Indicator
Acres of Conserved Land
This indicator measures the total number of acres in the region used for land and water preservation (i.e., forest preserves, natural areas, and conservation easements). This measure does not include acres of recreational parkland in the region, land used for golf courses, unprotected farm land, or land used for historic preservation.
Targets
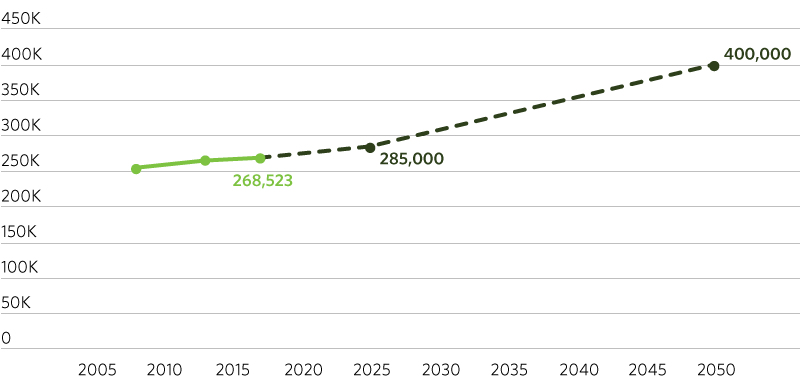
The 2025 target was developed by continuing a straight-line increase in acres of open space in the region based on the rate of land conservation from 2008 to 2017. The 2050 target matches the long-term target from GO TO 2040.
2025: 285,000 acres or more of conserved land
2050: 400,000 acres or more of conserved land
Sections
- Actual
- Target
GO TO 2040 Context
This indicator is a continuation of GO TO 2040’s “Acres of Conservation Open Space” indicator. GO TO 2040 set a 2015 target of 275,000 acres. As of 2017 the region was still short of that goal, with 268,523 acres conserved. As a result of this recent slow growth, the 2040 target of 400,000 acres has been pushed back to 2050, and the new goal for 2025 is 15,000 lower than the GO TO 2040 target for 2020.
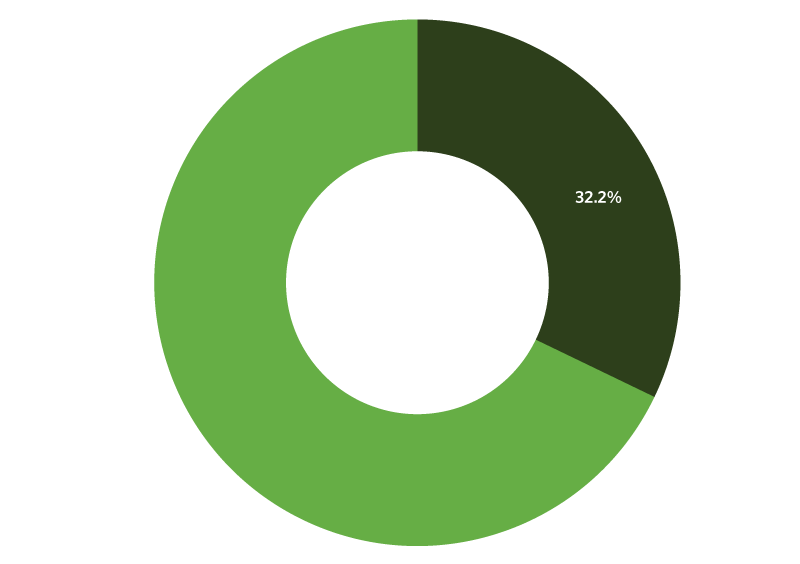
Protected Share of CMAP Conservation Areas Layer
This kindred indicator measures what percentage of CMAP’s Conservation Areas Layer lies within conserved land and water areas, including public open space and conservation easements. It provides a measure of how effectively land and water preservation implementers are aligning their efforts with regional conservation priorities.
- Protected
- Unprotected