Indicator
Percentage of Income Spent on Housing and Transportation by Moderate- and Low-Income Residents
This measure estimates the share of household income spent on housing and transportation (H+T) costs for moderate- and low-income households. For analysis purposes, any households with incomes below 80 percent of the regional family income are defined as low- and moderate-income. Data are from the Consumer Expenditure Survey (CES), which the U.S. Bureau of Labor Statistics (BLS) conducts annually. The survey collects information on household income and expenditures, including those for housing and transportation. Data are reported for the Chicago Metropolitan Statistical Area (MSA).
Targets
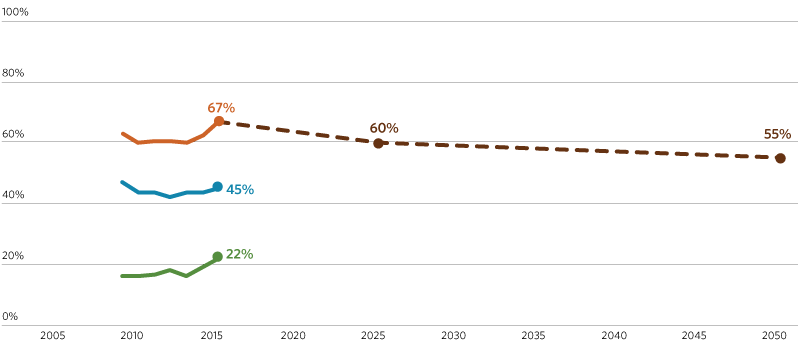
Staff reviewed regional affordability trends using this methodology since 2009, along with trends in overall housing affordability since 2000. The number of cost-burdened households (i.e., households paying more than 30 percent of their income on housing costs) has increased by more than 10 percentage points for both owners and renters. Since 2009, the combined H+T metric proposed here ranges from 60 to 67 percent, driven heavily by low- and moderate-income households spending a greater share of income on transportation costs. The 2025 target represents a near-term return to the recent low of 60 percent (from 2013). The 2050 target represents a continued decrease from the 2025 target, taking into account the range in which this metric has historically fluctuated, the policies of ON TO 2050, and the share of households expected to live outside of highly infill supportive areas.
2025: 60 percent or less of income spent on housing and transportation by moderate- and low-income residents.
2050: 55 percent or less of income spent on housing and transportation by moderate- and low-income residents.
Sections
- Housing
- Transportation
- Housing + Transportation
- Targets
Inclusive Growth Perspective
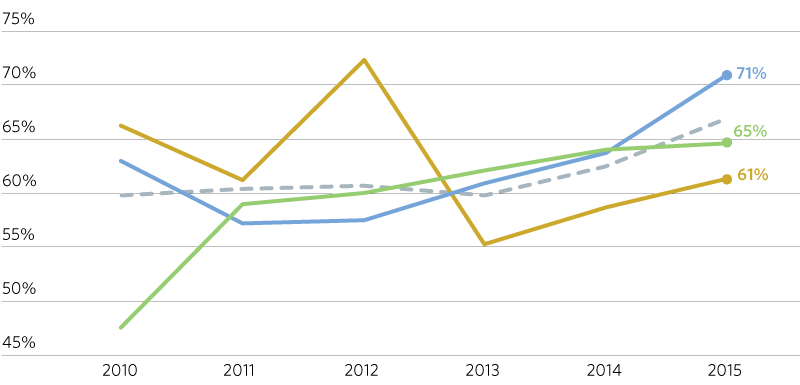
As a kindred indicator to this core indicator, ON TO 2050 will track the share of household income spent on housing and transportation costs for moderate- and low-income households by race and ethnicity. The share of household income spent on housing and transportation costs for moderate- and low-income households differs by races and ethnicities. Black and white households have seen increases in the share of household income spent on housing and transportation costs. The share of income spent by Hispanic households on housing and transportation has decreased from 66 percent in 2010 to 61 percent in 2010. However, even Hispanic households have seen increases in their share of income spent on housing and transportation costs in the last three years. Further, the share of income spent by black households on housing and transportation costs has increased every year between 2010 and 2015. Data for other racial and ethnic households, including Asian households, are not shown here due to small sampling size.
- All low- and moderate-income
- Black (non-Hispanic)
- Hispanic
- White (non-Hispanic)
GO TO 2040 Context
This indicator is based on one of the same name from GO TO 2040, although the methodology for calculating it has been modified significantly. This makes comparison between the two difficult. However, as of 2014, the region was not on track to meet the targets set in GO TO 2040. From 2010 to 2014, the share of income spent on housing and transportation by moderate- and low-income residents (using the GO TO 2040 methodology) increased from 55 percent to 61 percent, while GO TO 2040 had established targets of 53 percent for 2015 and 45 percent for 2040. While housing costs accounted for a relatively stable share, the share from transportation costs rose steadily during this period.