Secondary Kindred Indicator
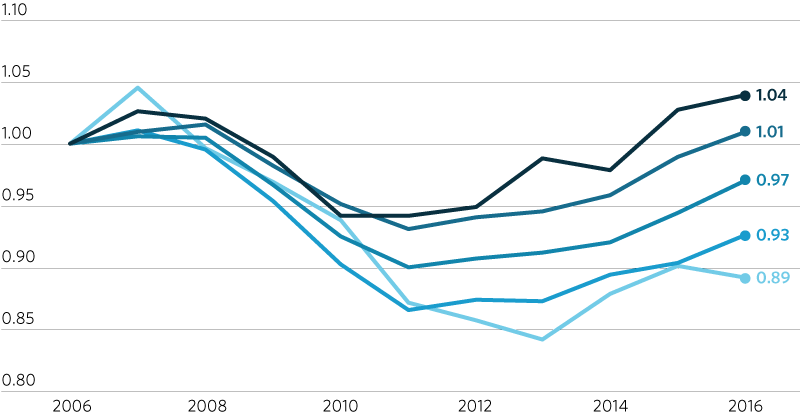
Change in Mean Household Income since 2006 by Quintile
This indicator measures change in mean household income since 2006 by quintile in the Chicago metropolitan statistical area. The degree to which regional prosperity is shared among all segments of the population drives long-term economic success of regional economies. To meet its potential, the region's economy requires opportunities for all residents to contribute to and benefit from its growth. Promoting an inclusive model of economic growth can improve outcomes for lower-quintile households and increase the size of the overall economy.
Indicator
Graphical representation of data follows. You can skip to data download
Change in mean household income since 2006 by quintile
Key
- 1st quintile (lowest income)
- 2nd quintile
- 3rd quintile
- 4th quintile
- 5th quintile (highest income)
Source
CMAP analysis of data from the U.S. Census Bureau’s American Community Survey (ACS)