Indicator
Water Demand
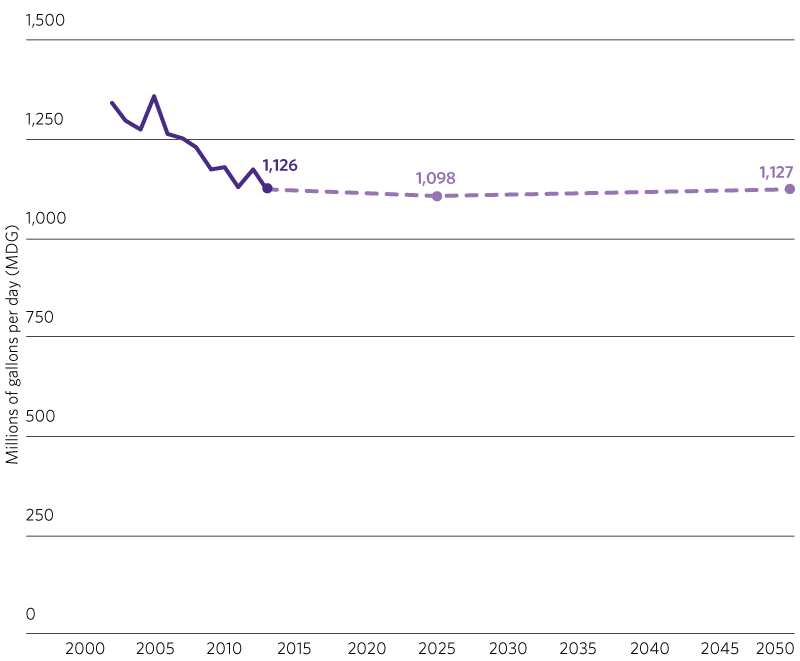
This indicator tracks total daily water demand, as well as per capita demand for residential water use. Total water demand includes water that is withdrawn, treated, and delivered to residential, industrial, commercial, governmental, and institutional users via public supply water systems, as well as industrial and commercial wells. Assessing long-range forecasted demands can inform the region on the sufficiency of water supply and encourage actions that conserve water, protect supply, and/or pursue alternative drinking water sources.
Targets
This indicator has two sets of targets -- one measuring total daily water demand, and one measuring daily residential water demand on a per capita basis. Per capita measurement allows for an examination of water conservation as an increase in total demand due to population or industrial growth can mask gains in conservation. At the same time, it is important to examine total demand because potable water is a finite resource and growth in our region is expected to increase the demand for water in 2050 above the current level of consumption.
Target values are based on the updated regional water demand forecast, which is set to be released in October 2018. The updated regional water demand forecast utilizes CMAP’s ON TO 2050 socio-economic forecast.
Total daily water demand
2025: 1,098 million gallons of water used daily
2050: 1,127 million gallons of water used daily
Sections
- Recent withdrawals
- Projected withdrawals
Note: Even with more residents and jobs, water demand is anticipated to be relatively stable due to conservation and efficiency. Forecast includes withdrawals from public water supplies, industrial and commercial self-supply wells, and domestic self-supply wells.

Daily regional residential water demand per capita
2025: 72.7 gallons of water used daily per capita
2050: 65.2 gallons of water used daily per capita
- Actual
- Target

Lake Michigan Withdrawals
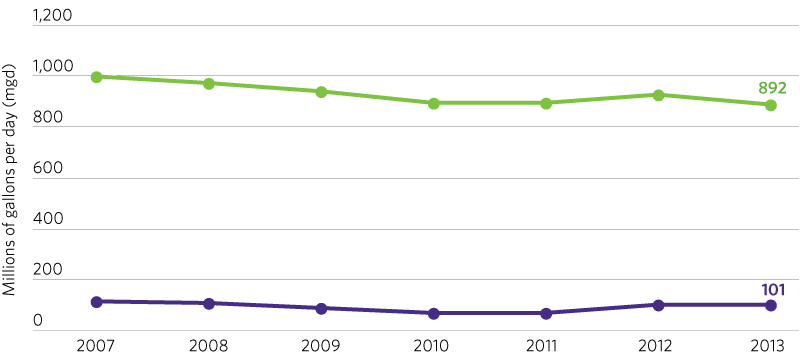
In addition to overall water demand, water use from Lake Michigan is an area of interest for the CMAP region. In response to a U.S. Supreme Court consent decree, the State of Illinois regulates Lake Michigan water use for those communities with an allocation for lake water. This kindred indicator measures water use and levels of non-revenue water loss from community water suppliers in order to track conservation and water loss reduction efforts.
- Net annual pumpage
- Water lost

Deep Bedrock Aquifer Withdrawals
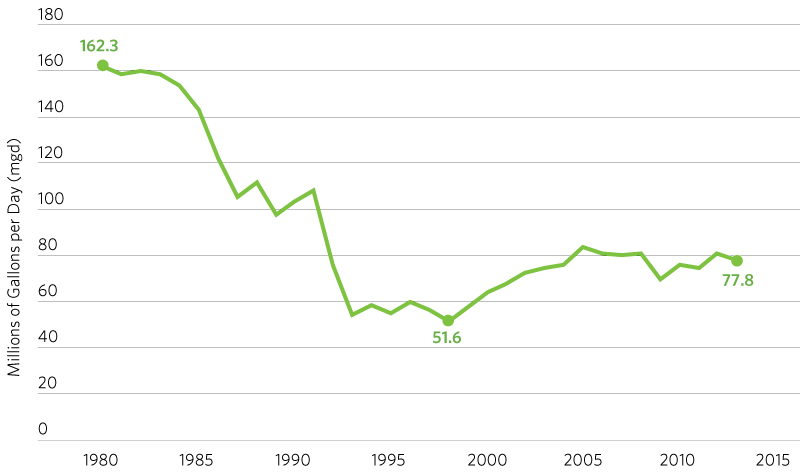
In addition to reporting on overall water demand and the diversion of water from Lake Michigan, it will also be instructive to measure total annual groundwater withdrawals from deep bedrock aquifers (Ancell Unit of bedrock and deeper) in the CMAP region (measured in millions of gallons per day). This will help provide a more complete assessment of water conservation in the region.
- Deep bedrock aquifer withdrawals

GO TO 2040 Context
This indicator is adapted from the GO TO 2040 “Public Supply Water Demand” indicator, which was based on a water demand forecast focused on the public water supply sector. The ON TO 2050 indicator is based on a new water demand forecast, which also considers withdrawals from private wells serving businesses or private residences. As a result, the data and targets are not comparable between the two, although it should be noted that the GO TO 2040 targets allowed for an increase in overall demand while the ON TO 2050 targets are virtually flat despite anticipated population growth.