Indicator
Workforce Participation
This indicator tracks the percentage of the regional population (age 20-64) that is either working or actively looking for work. An increase in workforce participation is generally viewed as a positive indicator of regional economic opportunity. Increased participation suggests a decrease in the number of discouraged workers -- individuals who are able to work but currently unemployed, and who have not searched for employment in the last four weeks due to a lack of suitable options or a lack of success through previous job applications.
However, workforce participation is a complex measure because it tracks both the number of employed persons and unemployed persons currently looking for work. Thus an increase in unemployment can register as an increase in workforce participation. Similarly, decreases in workforce participation may be due to an increase in the number of discouraged job seekers, or to an increase in the number of people choosing to retire early or leave the workforce for other reasons. Even with these caveats, an increase in workforce participation is generally indicative of a healthy economy.
Targets
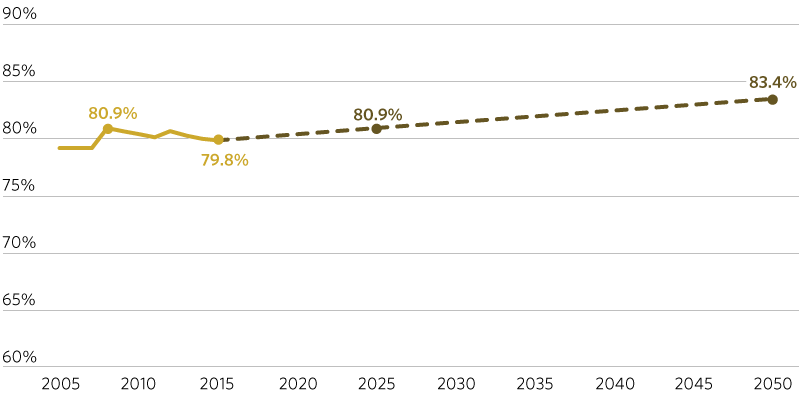
The Chicago region experienced a 0.6 percentage point decrease in its workforce participation rate between 2010 and 2015, despite the region’s ongoing recovery from the most recent recession. Among peer metropolitan areas, fluctuations in workforce participation rates tend to mirror each other, suggesting that macroeconomic factors contribute heavily to such trends. The goal for the Chicago region is to return to its previous 10-year high of an 80.9 percent workforce participation rate by 2025 and then maintain this steady annual growth rate of 0.1 percentage points through 2050.
2025: Regional workforce participation rate of at least 80.9 percent
2050: Regional workforce participation rate of at least 83.4 percent
Sections
- Actual
- Target
Inclusive Growth Perspective
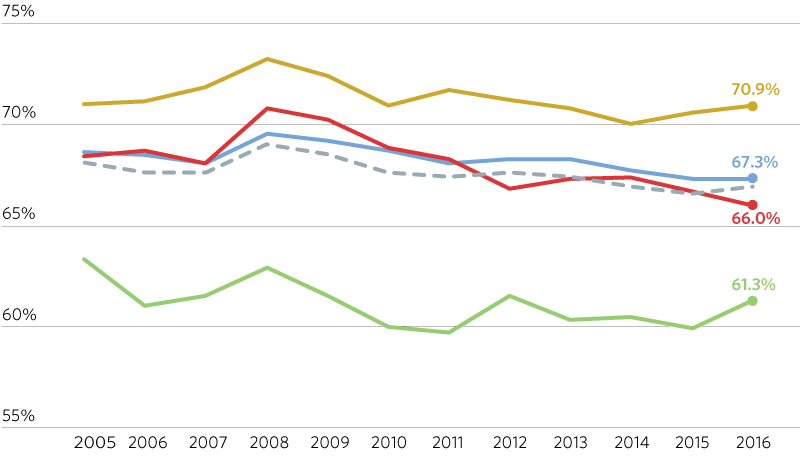
As a kindred indicator, ON TO 2050 also will track the share of the population in the Chicago metropolitan statistical area age 16 years and over that is either working or actively looking for work by race and ethnicity. Demographic groups participate in the workforce at differing rates. Black residents participate in the workforce at significantly lower rates than residents of other races or ethnicities.
- All residents
- Asian
- Black (non-Hispanic)
- Hispanic
- White (non-Hispanic)
GO TO 2040 Context
This indicator was introduced as part of the GO TO 2040 Plan Update, with a 2020 target of 82.8 percent for ages 20-64 (holding steady after that point). Since the Plan Update, the regional workforce participation rate declined slightly to 79.8 percent in 2015.