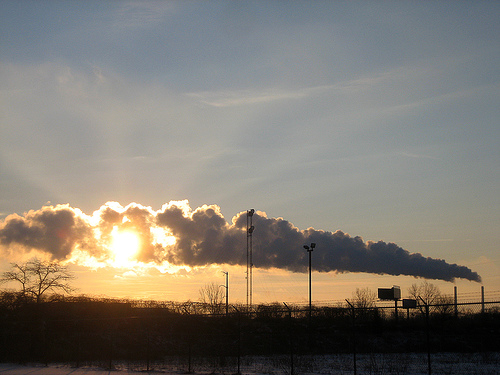
Air Quality Scenario Outcomes
Photo by Flickr user akeg
Understanding regional air quality is important, as it affects our health, economy, and environment. The seven-county metropolitan Chicago region is in "nonattainment" with federal standards, meaning that air pollution levels do not meet Clean Air Act standards intended to protect human health and the environment. Recent years have seen improvement, however, and numerous partners across the region and the state are committed to improving air quality.
Air quality is a heavily regulated issue. The IEPA and the USEPA are involved in setting standards, monitoring conditions, and developing programs to improve air quality. The role of CMAP in the air quality arena is to ensure that the Transportation system of northeastern Illinois meets air quality "budgets" set by IEPA, both currently and into the future.
Air quality has improved dramatically in the last several decades, and continued improvements are expected. Much of the improvement is caused by technological advances that reduce emissions of harmful pollutants, or by national-level policy. However, Transportation and land use decisions do play a part in affecting air quality; automobile traffic and construction of Transportation facilities are both significant sources of air pollution.
In the tables below, the Transportation emissions associated with two criteria pollutants in each scenario are shown. Two emissions are related to particulate matter (PM 2.5) and are measured annually; these are fine particulates and nitrogen oxides (NOx). Two are related to ozone, and daily summer averages are used; these are volatile organic compounds (VOC), and NOx.
Particulate matter
If current trends continue, the region's Transportation system will emit around 1,040tons of fine particulate matter and 20,600tons of nitrogen oxides (NOx) each year in 2040. Both of these are dramatically lower than current emissions levels, due to expected technological improvements. The table below estimates the change in these emissions that will occur from these reference figures (with a decrease considered to be an improvement).
Change from the current trend |
|
|
Reinvest |
Worsens slightly |
|
Preserve |
Improves slightly |
|
Innovate |
Worsens slightly** |
Fine particulates (annual) |
|
|
Reinvest |
+1% (13 more tons) |
|
Preserve |
-3% (30 fewer tons) |
|
Innovate |
+1% (4 more tons) |
NOx (annual) |
|
|
Reinvest |
+3% (665 more tons) |
|
Preserve |
-3% (632 fewer tons) |
|
Innovate |
+3% (544 more tons) |
What strategies in this scenario caused this change? |
|
|
Reinvest |
Additional auto travel occurred in this scenario, largely because of the arterial and expressway improvements that were included. |
|
Preserve |
Transit, bicycling and walking, and other low-capital transportation strategies reduced driving in this scenario, leading to air quality improvements. |
|
Innovate |
Some travel was shifted to alternative modes by technology and pricing transportation strategies, but overall auto miles increased. The figures presented here do not include the use of alternative fuels, which would have a significant impact on this outcome; estimation of these results is underway. |
** See note concerning alternative fuels.
Ozone
Ozone is formed from a complex chemical interaction that involves certain compounds and weather conditions. The formation of ozone is a greater threat in the summer, so average summer daily figures are used to measure ozone, rather than annual ones. If current trends continue, the region's transportation system will emit around 64 tons of volatile organic compounds (VOC) and 51 tons of nitrogen oxides (NOx) each summer day. As noted for PM 2.5, both of these are dramatically lower than current emissions levels, due to expected technological improvements. The table below estimates the change in these pollutants that will occur from these reference figures (with a decrease considered to be an improvement).
Change from the current trend |
|
|
Reinvest |
Worsens slightly |
|
Preserve |
Improves slightly |
|
Innovate |
Worsens slightly** |
VOC (summer daily) |
|
|
Reinvest |
+7% (4.1 more tons) |
|
Preserve |
-4% (2.3 fewer tons) |
|
Innovate |
+2% (1.4 more tons) |
NOx (summer daily) |
|
|
Reinvest |
+2% (1.2 more tons) |
|
Preserve |
-3% (1.5 fewer tons) |
|
Innovate |
+3% (1.5 more tons) |
What strategies in this scenario caused this change? |
|
|
Reinvest |
See above discussion. |
|
Preserve |
See above discussion. |
|
Innovate |
See above discussion. |
** See note concerning alternative fuels.
Although some of the scenarios worsen air quality compared to the projection of current trends to 2040, it should be noted that these emission levels are still far lower than today. Other information on air quality will be released during summer 2009 in a report on this subject; a draft of the report is available here.
