Congestion Scenario Outcome
Original photo by Flickr user: sarah-ji
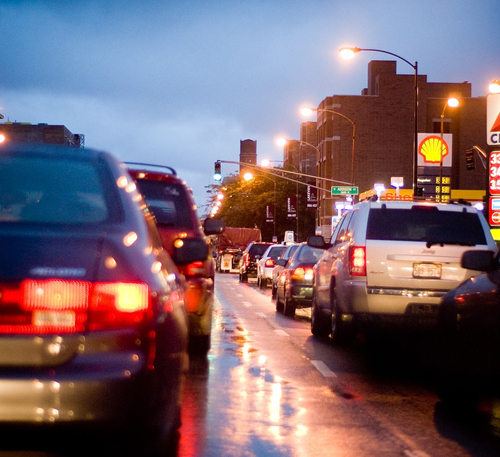
Congestion is a significant problem in the region. National rankings of congestion in metropolitan areas typically rank Chicago as third-worst in the nation. Congestion wastes fuel and creates air pollution, makes the region less attractive to businesses, creates negative economic impacts due to wasted time, and is even shown to cause health problems. This outcome is closely related to the "job access" and "travel times" outcomes.
Congestion is measured in this analysis as the percentage of all vehicle hours traveled (VHT) and vehicle miles traveled (VMT) that are spent in congested conditions, defined as periods when the volume of traffic on a roadway exceeds its capacity. The measures sometimes yield different results – as illustrated below – but taken together, provide a useful approximation of congestion. Currently, around 2.6 million vehicle hours per day are spent in congestion, which is 36% of all vehicle hours traveled. This is forecast to increase to 3.7 million hours per day, or 42% of all vehicle hours traveled.
From the vehicle miles traveled (VMT) perspective, around 32 million vehicle miles are spent in congestion, which is 18% of the total. This is forecast to increase to 48 million vehicle miles, or 24% of all vehicle miles traveled.
Vehicle hours traveled
The impacts of each scenario on vehicle hours traveled in congestion are described below, estimating VHT in congestion compared to the current trend (with a decrease considered to be an improvement). The base figure is 3.7 million hours.
Change from current trend |
||
|
Reinvest |
Improves greatly |
|
|
Preserve |
Improves slightly |
|
|
Innovate |
Improves slightly |
|
Change in congestion |
||
|
Reinvest |
-45% (1.7 million fewer hours) |
|
|
Preserve |
-6% (215,000 fewer hours) |
|
|
Innovate |
-4% (164,000 fewer hours) |
|
What strategies in this scenario caused this change? |
||
|
Reinvest |
|
|
|
Preserve |
Transportation strategies including improved transit service, bicycle and pedestrian improvements, transportation demand management, and other low-capital strategies were applied. These shifted travel away from autos, with congestion reduction benefits. |
|
|
Innovate |
Several technology and pricing transportation strategies were included in this scenario, but trip distances were generally longer, leading to a small decrease in congestion levels. |
Vehicle miles traveled
The impacts of each scenario on vehicle miles traveled in congestion are described below, estimating VMT in congestion compared to the current trend (with a decrease considered to be an improvement). The base figure is 48 million miles.
Change from current trend |
|
|
Reinvest |
Improves greatly |
|
Preserve |
Improves slightly |
|
Innovate |
Improves |
Change in congestion |
|
|
Reinvest |
-40% (19 million fewer miles) |
|
Preserve |
-3% (1.2 million fewer miles) |
|
Innovate |
-16% (7.8 million fewer miles) |
What strategies in this scenario caused this change? |
|
|
Reinvest |
As noted above, infrastructure improvements were made which improved travel conditions for all modes. |
|
Preserve |
As noted above, small-scale improvements shifted trips from autos to alternative modes, reducing congestion. |
|
Innovate |
As noted above, technology and pricing strategies were implemented. This scenario reduced congested VMT more extensively than congested VHT. |
These estimates were calculated by using the CMAP travel demand model to estimate the impacts of the strategies in the reports linked above. Documentation of travel demand model features is available here.
