Brownfields Existing Conditions
Existing Conditions
What has already been cleaned up?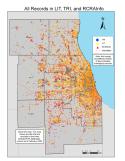
In addition to determining the current distribution and amount of potential brownfields in the region, it is important to determine what has already been done in terms of clean-up thus far.
The Illinois EPA manages the Site Remediation Program (SRP), and its website is an excellent clearinghouse for properties that have had to go through brownfield clean-up. A total of 3,029 sites have been enrolled in the voluntary program between July 1996 and December 2007. Of these, 1,903 have received a No Further Remediation (NFR) letter, a commonly required stamp of approval to receive development financing. Additionally, more than 17,000 acres of land have been remediated and enrolled in the SRP throughout the region. This data has been organized in Table 1 by county and is displayed in Map 1. As to be expected, the majority of SRP sites are in Cook County, with 51% of the sites in the City of Chicago, but all counties in the region have sites listed.
Table 1: Site Remediation Program (SRP) Sites in Region (1996-2007)

How is a site determined to be a brownfield?
Any site that requires clean-up up or is perceived to require clean-up can be considered a brownfield. Contrary to what many people may think, there is no formal recognition or process required for the term brownfield to be applied. If the land does or potentially requires remediation, which in turn may complicate its reuse, it is a brownfield.
Where is contaminated land?

To identify the land that could potentially be classified as brownfields throughout the seven county northeastern Illinois region, several data sources were used. The US EPA and the Illinois EPA provide a wealth of information and data online on their programs. The US EPA manages a site called the Envirofacts Data Warehouse where users can access information on environmental activity including information on: Superfunds, hazardous waste, toxic releases, facilities subject to environmental regulations, air releases, and brownfield grant recipients (US EPA 2). Additionally, the IEPA requires buildings and sites with activities or conditions of "environmental interest" to report to the appropriate division within the Bureau of Land, and IEPA makes much of this reported information publicly available on its website (IEPA).
Several types of environmental conditions and reporting are of particular value when identifying potential brownfields. The most useful and relevant data to this research include: sites registered in the Toxic Release Inventory (TRI), the Local Incident Tracking system (LIT), and Hazardous Waste Handlers (maintained in the RCRAInfo database).
Map 2 shows the location of each site throughout the region with a record in the LIT, TRI, and RCRAInfo databases. Table 2 reveals the number of each type of contamination record by county, as well as the totals for each county. There are a total of 38,051 combined records in the northeastern Illinois region, 65% of which are in Cook County. The most common data type are on sites and facilities reporting to the EPA on activities related to hazardous material handling, contained in the RCRAInfo database (see Chart 1). The map clearly shows the extent of the data, and that several sites have more than one type of contamination. Overall, the location of the data appears to be logical with concentration in areas that are developed, along transportation corridors, and clusters of similar land use. This conformed with much of what was repeatedly communicated in interviews with the region's key brownfields professionals: brownfields are everywhere.
Table 2: EPA Contamination Identification by County in Region


Which sites are not in operation?
Mapping all the contamination data does not reveal potential brownfield sites, however. Businesses and sites that are currently in operation are included in these US EPA records, and therefore should be distinct from the sites that are not in operation and are available for redevelopment. Unfortunately, the data sets do not specify the sites that are no longer operating. In order to locate these sites where redevelopment may be hindered by its potential brownfield status, the data sets were layered with 2006 county assessor data to select the US EPA records on vacant and selected exempt land. This identified sites that are probably not in active use, which when compared with contaminated sites, could be used as an approximation of potential brownfields that are available for redevelopment. CMAP's Regional Snapshot on Infill explains the methodology for identifying vacant land. The selection of exempt land is detailed in the appendix.
Where are the possible brownfield sites? (Map 3) 
Identifying the sites that are required to report to the US EPA, such as storage of hazardous waste, shows where land is at risk of contamination. Layering this information with vacant and selected exempt land more accurately reveals potential brownfield sites. Map 3 portrays this estimation of potential brownfield sites throughout the region – it includes all the records in the TRI, LIT, or RCRAInfo in the region, filtered by vacant and exempt land. It estimates a total of approximately 8,195 sites throughout the region. Many of these sites have more than one type of contaminant, and Table 3 shows the number of parcels with one, two, and three types of contamination (parcels listed in more than one of the three databases evaluated—TRI, LIT, and RCRAInfo). It is logical to assume that a parcel with multiple records in the evaluated EPA databases is likely to have a higher risk of contamination than a parcel with a single record.
Table 3: Potential Brownfield Sites in Region


How do these potential brownfield sites compare with known brownfield sites? 
This data selection method has limitations (see Appendix for detailed description of methodology and assumptions), and undoubtedly some land is displayed that is inaccurately being defined as a potential brownfield. In order to measure the closeness between the identified potential brownfields and confirmed brownfields in the SRP, the land uses of each were compared. Additionally, the SRP sites were mapped with the potential sites to assess the location similarities and differences in remediated sites and potential brownfield sites. The correlation between the two data sets was evaluated, calculating a correlation coefficient of .78, a strong match.
|
Does the location and extent of brownfields surprise you in any way? |