Impact of Inclusionary Zoning Policies
Determining the Impact of Potential Inclusionary Zoning Policies
Ideally, an analysis of inclusionary zoning in northeastern Illinois would measure the impacts of various ordinances that have been tailored to meet the specific characteristics of each municipality or county. For example, the projected population growth rate of a community can have a significant impact on the total amount of affordable housing produced through an IZ policy. Further, the establishment of a task force to engage various stakeholders can help to determine ordinance criteria that are appropriate for the context of a specific community.
To better determine the potential impact of inclusionary zoning if broadly instituted throughout the region, two samples with a standard set-aside variable are used. This approach has limitations because it is unable to factor in the typical local nuances of IZ policies; however it does illustrate the potential impact of inclusionary zoning if the region were to adopt various policies. Please note that this should not be interpreted as a recommendation from CMAP concerning how inclusionary zoning should be adopted in this region. We provide these examples to illustrate how potential inclusionary zoning policies might affect the region.
For the purposes of this report, "affordable housing" is defined as housing that can be afforded by people who make less than the area median income (AMI) for the Primary Metropolitan Statistical Area of Chicago. According to this definition, which is based on standards used by the Illinois Housing Development Authority, housing that can be purchased by people who make 80% of AMI or below and housing that can be rented by people who make 60% of AMI or below is affordable.
The sample inclusionary zoning policies in this analysis were based on the most common policies in other cities, as determined through the literature review. Since the IZ policies were analyzed across the entire region, it is most appropriate to apply a policy that is neither excessive nor ineffective. The sample policies used are:
- A ten percent set-aside for all new residential developments in every municipality; and
- A three-tiered policy of ‘No' policy, ‘10-percent' set-aside, and ‘20-percent' set-aside for all developments at the municipal level, depending on the percentage of the existing housing stock that is affordable (2000 U.S. Census). This policy assumes that municipalities with lower supplies of affordable housing will adopt policies that are more aggressive in creating affordable housing.
 In order to estimate how many affordable units would be created through each policy and the impacts this would have on the region, 2030 forecast data was analyzed to determine the projected affordable housing supply in 2030. Housing data from the 2000 U.S. census determined a baseline of current affordable housing stock for each municipality. Holding the ratio of rental to owner-occupied tenure, and the respective affordable housing stock constant (2000), affordable housing supplies were projected for 2030 under a baseline scenario. By applying the two aforementioned sample policies, inclusionary zoning policies were analyzed among municipalities in the region.
Please click the thumbnail to view a map of the percent of affordable housing units in the region in 2000.
Table 1. Regional Affordability in 2000
| County | Affordable Units in 2000 |
% of Total Housing that is affordable in 2000 |
| Cook |
901,621 |
47.11% |
| Cook w/o Chicago |
308,165 |
36.14% |
| DuPage |
56,339 |
19.18% |
| Kane |
51,358 |
38.59% |
| Lake |
56,255 |
28.62% |
| McHenry |
15,493 |
25.62% |
| Will |
50,582 |
44.64% |
| Total* |
1,131,648 |
41.75% |
| * Including Chicago |
Measuring the number of units available can help to determine the supply-side of affordable housing however, it doesn't account for families that live in affordable housing but could afford more expensive housing (thus making affordable units unavailable to those who need them). Another proxy for measuring affordability is to examine housing cost-burden. Housing cost-burden is defined as households paying in excess of thirty-percent of gross income on housing. Measuring housing cost-burden can help to determine the demand side of affordable housing. In northeastern Illinois housing cost-burden has drastically increased in the recent decades up from twenty-nine percent in 1990 to forty-one percent in 2006. While this research primarily focuses on the supply-side of affordable housing, it is worth noting that with escalating housing values and diminishing incomes, the demand for more affordably housing is growing precipitiously.
Sample Policy 1: Universal 10-Percent Inclusionary Zoning
Without new affordable housing policies, it is anticipated that of the 728,907 forecasted additional households by 2030, 332,755 would be affordable housing units when holding ratios constant with 2000 data. Under a universal 10-percent set-aside, northeastern Illinois could add an additional 50,000 affordable units to the housing stock that would not otherwise be realized through the baseline scenario. This represents an overall 1.45 percent increase in the regional affordable housing stock (as a percentage of total housing units). Therefore, a 10 percent universal inclusionary zoning policy in the aggregate would result in a relatively significant increase in new affordable housing units. The results, however, vary by county primarily due to anticipated growth rates and the amount of existing affordable housing stock.
Table 2: Universal Inclusionary Zoning Policy with a 10% Set-Aside (aggregated to county)
| County | Affordable Units in 2000 | % Affordable in 2000 | Annual Growth Rate | Additional AF Units Created by IZ in 2030 | % Affordable w/ IZ in 2030 |
| Cook |
901,621 |
47.11% |
0.05% |
14,482 |
47.91% |
|
Cook w/o Chicago |
308,165 |
36.14% |
0.04% |
7,472 |
37.14% |
|
DuPage |
56,339 |
19.18% |
0.06% |
4,925 |
20.23% |
|
Kane |
51,358 |
38.59% |
2.16% |
7,865 |
39.65% |
|
Lake |
56,255 |
28.62% |
1.15% |
5,748 |
30.59% |
|
McHenry |
15,493 |
25.62% |
2.95% |
6,310 |
29.65% |
|
Will |
50,582 |
44.64% |
3.15% |
11,362 |
42.52% |
|
Total* |
1,131,648 |
41.75% |
0.86% |
50,693 |
41.98% |
| * Including Chicago |
Results of a 10% set-aside by county (aggregated from the municipality) are shown in Table 2. While Cook County would certainly experience the largest net gain in affordable units due to its proportion of households in the region, the collar counties McHenry, Kane and Will would experience a higher percentage increase in affordable units due to the higher projected growth rates. In order for an inclusionary zoning policy to create a large quantity of new affordable units, new households need to be added at a significant rate. For example, DuPage County would not realize significant increases in its affordable housing stock as compared to other counties due its relatively low growth rate and low levels of existing affordable housing units. In this instance, policy directions might address how to create more affordable housing options where new developments are not anticipated en masse.
Table 3. Municipalities with Greatest Net Increase in Affordable Units w/10% Inclusionary Policy as Percentage of Total Units
|
City |
County |
Annual Growth Rate |
Total Number of Units in 2000 |
2000 % Affordable |
Add'l |
2030 % Affordable with IZ |
| Chicago | Cook | .05% | 1,060,972 | 55.94% | 7010 | 56.51% |
| New Lenox | Will | 5.39% | 5,822 | 19.98% | 1789 | 26.32% |
| Sugar Grove | Kane | 9.71% | 1,289 | 9.70% | 1762 | 18.17% |
| Elgin | Kane | 2.03% | 31,532 | 45.42% | 1430 | 47.89% |
| Naperville | DuPage | .96% | 43,715 | 9.03% | 1324 | 11.31% |
| Plainfield | Will | 5.19% | 4,284 | 13.61% | 1318 | 20.35% |
| Frankfort | Will | 5.36% | 3,420 | 6.90% | 1206 | 14.27% |
| Huntley | McHenry | 6.66% | 2,369 | 14.73% | 1195 | 22.03% |
| Aurora | Kane | 1.24% | 46,577 | 48.46% | 1068 | 50.05% |
| Manhattan | Will | 9.24% | 1,153 | .86% | 927 | 44.54% |
Results for the cities with the greatest increase in affordable housing percentages are shown in Table 3. Consistent with the above discussion, the communities that would add the most affordable housing through inclusionary zoning are those where the most growth is projected to occur by 2030.
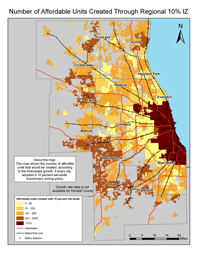
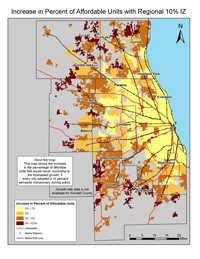
Click on the images above to open maps showing the number of affordable units by municipality created through the universal 10-percent IZ policy and the percent increase. These maps indicate that the greatest percentage increases in affordable housing would occur in high-growth communities in less-developed parts of the region, though larger communities like Chicago and Aurora would add more affordable units in total.
Sample Policy 2: "Tiered" Inclusionary Zoning
When applying the ‘tiered' policy, that is, either ‘No' IZ policy, a ‘10-percent' set-aside, or a ‘20-percent' set-aside depending upon the percentage of existing housing stock that is affordable, the results vary substantially from the ‘Universal' ten-percent policy. The most notable impact in the tiered system is its boost to affordable housing production in communities where little affordable housing currently exists. At the regional level, the quantity of affordable housing produced between these two methods is marginal; however, the tiered policy would better distribute affordable housing to communities which currently lack such a supply. For example, a 20-percent set-aside for the 47 municipalities that currently have the lowest supply of affordable housing would create over 9,000 affordable units by 2030, which is more than a 100-percent increase for these communities. Tailoring IZ policies to fit the housing demographics of specific communities is palpably more effective at spatially distributing affordable housing throughout the region.
Table 4. Tiered Policy by County
| County | Affordable Units in 2000 | % Affordable in 2000 | Annual Growth Rate | % Affordable in 2030 w/o IZ | Add'l Affordable Units Created by IZ in 2030 | 2030 % Affordable with IZ |
| Cook |
901,621 |
47.11% |
0.05% |
47.25% |
14,839 |
47.93% |
|
Cook w/o Chicago |
308,165 |
36.14% |
0.04% |
36.37% |
7,828 |
37.17% |
|
DuPage |
56,339 |
19.18% |
0.06% |
18.93% |
5,365 |
20.45% |
|
Kane |
51,358 |
38.59% |
2.16% |
36.54% |
7,557 |
39.53% |
|
Lake |
56,255 |
28.62% |
1.15% |
28.51% |
6,771 |
30.96% |
|
McHenry |
15,493 |
25.62% |
2.95% |
25.29% |
6,683 |
29.91% |
|
Will |
50,582 |
44.64% |
3.15% |
38.56% |
11,816 |
42.68% |
|
Total* |
1,131,648 |
41.75% |
0.86% |
40.53% |
53,029 |
42.04% |
| * Including Chicago |
Table 5. Cities with Greatest Increase of Affordable Units w/ Tiered Policy
| City | County | Annual Growth Rate | Total Number of Units in 2000 | 2000 % Affordable | Add'l Affordble Units Created by IZ in 2030 | 2030 % Affordable with IZ |
| Chicago |
Cook |
0.05% |
1,060,972 |
55.94% |
7010 |
56.51% |
|
Frankfort |
Will |
5.36% |
3,420 |
6.90% |
2412 |
21.63% |
|
New Lenox |
Will |
5.34% |
5,822 |
19.98% |
1789 |
26.32% |
|
Sugar Grove |
Kane |
9.71% |
1,289 |
9.70% |
1762 |
18.17% |
|
Elgin |
Kane |
2.04% |
31,532 |
45.42% |
1430 |
47.89% |
|
Naperville |
DuPage |
0.96% |
43,715 |
9.03% |
1324 |
11.31% |
|
Plainfield |
Will |
5.12% |
4,284 |
13.61% |
1318 |
20.35% |
|
Huntley |
McHenry |
6.66% |
2,369 |
14.73% |
1195 |
22.03% |
|
Aurora |
Kane |
1.24% |
46,577 |
48.46% |
1068 |
50.05% |
|
Spring Grove |
McHenry |
6.10% |
1,140 |
7.37% |
1035 |
22.75% |
See Table 4 for results by county and Table 5 for the cities with the greatest increases in affordable housing. Note that all of these communities have at least one of the two qualities necessary for inclusionary zoning to produce larger quantities of affordable housing: a high growth rate (the regional mean is 1.7%); and a large net increase in housing stock. The correlation between the development of new housing units and the creation of affordable housing units in an IZ policy means that the cities that have the highest number of projected new housing units are those that would create the most affordable housing. Not surprisingly, the municipality that is projected to create the most new housing units by 2030 is Chicago. On the other hand, nearly all of Chicago's bordering municipalities are projected to have less residential growth than the outer ring suburbs, as shown in the maps below.
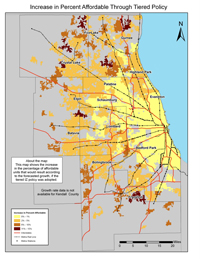

While both the universal 10-percent and tiered polices show improvements over the baseline scenario, the quantity of units produced and spatial distribution of their impacts vary. The most significant difference in each scenario is the geographic distribution of new affordable housing. While every municipality is assumed to adopt the same set-aside under the universal policy, under the tiered method, municipalities with the lowest percentages of affordable housing are assumed to adopt the most ambitious (20%) set-aside. It exempts municipalities with the highest percentage of affordable housing from a required set-aside. With the tiered method, only the municipalities that have a moderate level of affordable housing adopt a 10-percent set-aside. The customization of the tiered policy allows for greater affordable housing gains in the cities that need them most, and lesser or no gains in cities that already have substantial affordable housing percentages.
| These policies are presented as examples, not recommendations. That said, which of the above examples do you think is more desirable? What other possibilities are there for how local governments in the region could address inclusionary zoning policies? |