Overview of Existing Conditions
Overview of Existing Conditions
Institutional Conditions
In 1996, Illinois ranked 48th in the nation in the area of public recreation land per acre (Hoffman, 1996). In a more recent comparison to other Midwestern states, IL did not fare much better, at sixth of seven states in percentage of area and is last by a wide margin on a per capita basis (Figs. 2 & 3). In the 5 years from 1995 to 2000, the Chicago metropolitan region lost more than 140,000 acres of rural grasslands and wetlands. In the northeastern Illinois region, we are fortunate to have the Forest Preserve and Conservation Districts system that has been acquiring land to insure the retention and management of natural lands surrounding the Chicago metro area. In addition to the above, Park Districts as firmly established taxing bodies are also quite effective in securing and managing open lands whether they tend to be strictly recreational, for conservation purposes, or a combination of both.
|
|
|
|
Fig. 2: Comparison of Parks & Open Lands in IL vs. other Midwestern States |
Fig. 3: Comparison of Recreation Areas in IL & other Midwestern States |


In spite of the above established bodies, the state can clearly benefit from a concerted effort to increase open space that places it on par with the rest of the nation. The Illinois Department of Natural Resources (IDNR) has been the leader in open space acquisition and has greatly helped the region in achieving various parks and open lands objectives. However, for the past several years, IDNR has experienced major funding and budgetary cuts that have restricted it from carrying out this important task.
There are various organizations in the northeastern Illinois region that have been advocating for and actively acquiring (or assisting in the acquisition of) open space and natural areas. From the standpoint of the region, we are well-placed to insure that the population continues to enjoy the benefits of this asset, particularly if it is incorporated in regional plans such as the GO TO 2040 Regional Comprehensive Plan. The growing population of the region, the changing demographics and the shrinking supply of open space (as identified by some park districts in their master planning efforts) necessitates a regional review to insure that supply of parks and open lands meets this changing demand in future planning. With a forecasted increase in population of 2.8 million in the NE IL region by 2040, development may continue to overcome open space. This is mainly due to the amount of land absorbed for new development, which frequently outpaces population growth. While the population in Chicago increased by 1% between 1970 and 1991, its urbanized area grew by 24% (IL Environmental Council, 2007).
| McHenry County could lose more than 10,000 acres of forest, 1,400 acres of wetlands, and 28,000 acres of urban and rural grasslands (some of which are parks and greenways) as well as a number of natural areas. Threatened natural resources include the high-quality Nippersink Creek subwatershed and rare fen communities along the Fox River. The Chain O' Lakes-Fox River watershed, which encompasses parts of McHenry, Lake, Cook, and Kane Counties, has the highest concentration of natural areas in all of Illinois (more than 30 are in McHenry County). If not protected in some manner, these natural resources could be lost forever to urbanization -SCORP, 2004 |
A study completed by Openlands Project in 1999 found that urban development in the Chicago region could expand 60 percent in the next 10 years and will more than double (1.2 million acres) in the next 30 years. IDNR used the model developed by Openlands to examine the potential impacts of urban development on natural resources in McHenry County which has an extensive amount of natural resources.
 |
|
Fig 4: Development Threats on Parks & Open Lands in McHenry County |
The northeastern IL region has passed 1 billion dollars in referenda for open space acquisition for the past 10 years (The Conservation Foundation, 2007).
The following section discusses the provision of parks and open lands in the 7-county region of Northeastern Illinois. Many organizations acquire, manage and/or operate parks and open space including: Forest Preserve Districts, Conservation Districts, Park Districts, and Land Trusts.
Table D: Land Holdings by Forest Preserve and Conservation Districts

Source: Openlands, 2006
In addition to the seven Forest Preserve/Conservation Districts, the region has approximately 150 Park Districts. Federal and state lands, such as wildlife refuges, national forests, and nature preserves, constitute part of the parks and open lands in our region. Also, Land Trusts in the region acquire land, generally for subsequent holding by the above districts or other governmental entities, and may or may not manage the land. The northeastern Illinois region has approximately fourteen Land Trusts. The reasons for obtaining lands vary from protection of natural resources or farmland to insuring the continuity of scenic vistas (info obtained from a survey of the region's land trusts). Lands acquired by trusts may also remain in private ownership with stipulations on land use/development, e.g. through conservation easements.
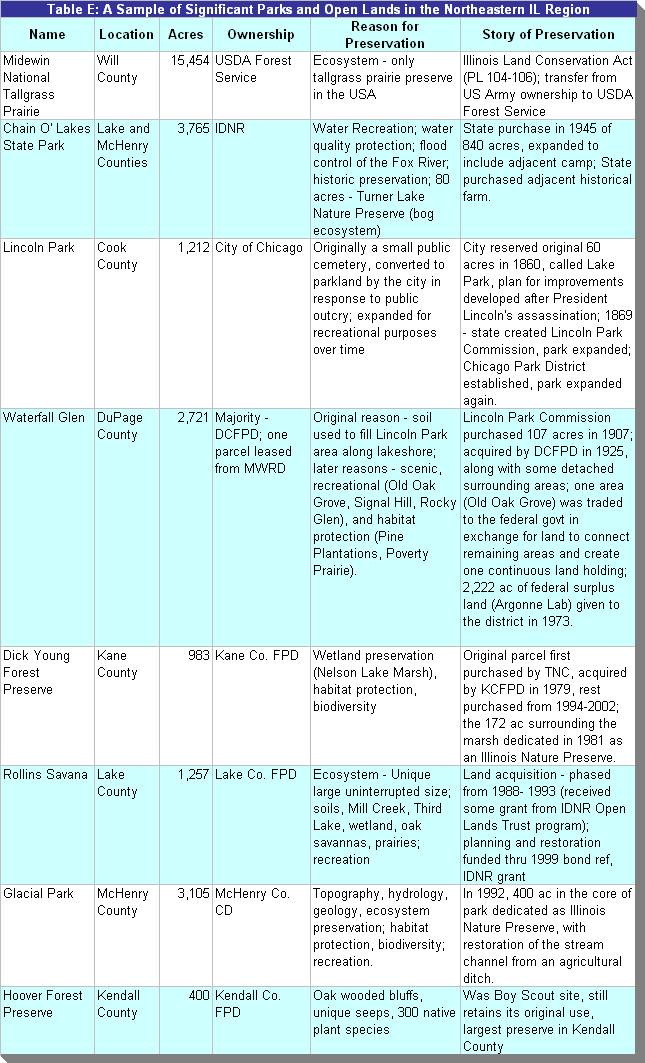 Table E shows a sample of some of the open space in our region. Most open space in the region has a history and special value to the localities making them unique and therefore in need of special attention. Unfortunately, some parks are not well-maintained and this can lead to the perception of unsafe surroundings. Others may become areas for criminal and undesirable activities that may lead to abandonment of the park and the neighboring sites. Thus, while considering the amount of parks and open lands in the region, it is critical to evaluate the extent of their "usability" and their overall effect on their service radius.
It is also important to geographically portray existing parks and open lands in the region. In the following sections we will show distribution of parks and open lands by census tracts and identify the accessibility of open space to population served. This can form the basis for assessing regional needs for parks and open lands which in turn can lead to strategies and policies to insure sufficient and equitable open space provision. A further analysis with population projections can lead to a more refined evaluation of the future needs of the population and to more policy proposals.
MAP 1 Regional Parks and Preserved Open Lands, portrays all the lands identified through the CMAP land use inventory as recreation or conservation land. All of the parks and preserved lands are categorized as neighborhood parks, community parks, regional parks, regional reserves, or special use lands, using NRPA guidelines. As demonstrated in the previous section, NRPA guidelines are based on use and amenities as well as size, but it was beyond the scope of this regional analysis to assess each park's use and amenities; therefore, approximations, based on acreage and use (determined from CMAP's land use inventory), were used to classify. Furthermore, regional information on mini-parks or tot-lots was not available, so they have not been included in this analysis.
 MAP 2 Distribution of Parks and Open Lands by Census Tract, is an approximate representation of the distribution of parks and open lands by population density. Census tracts are an accepted unit of geography for equalizing density throughout the region. In densely populated areas, tracts are much smaller, whereas in sparsely populated areas, tracts are very large. By totaling the acreage of parks and open lands within each tract and dividing it by the total acreage of the tract, a percentage of land that is parks or open lands within each tract can be determined. This percentage is displayed on the map.
The tracts with the highest percentage of parks and open lands seem to ring the more densely populated area, reflecting where most of the forest preserves are located. However, it is interesting to note that both the highly populated areas and the further suburbs have similar percentages of parks and open lands per tract.
 MAP 3 Urban Area Accessibility to Parks and Open Lands, is an approximate representation of how much of the region's population lives within ½ mile of a park or open lands. This map only represents the population categorized as living within the "urbanized area" as defined by the U.S. Census Bureau, i.e. 1,000 persons per square mile.
It is interesting to note that several of the areas without a park in a ½ mile radius are located at the periphery of the urbanized area. Upon some initial review, many of these lands are in unincorporated land, thereby explaining the lack of municipal parks or open lands.
This map does not account for physical accessibility barriers to reaching parks and open lands, e.g. active rail-lines between an area and an open space.
|
DISCUSSION QUESTION: Do you know of a unique park/open space in your community? Can you describe what makes it a special space? |