Choosing Indicators
Ten primary indicators from GO TO 2040 as adopted have been modified or replaced. Revised indicators meet at least one of the following criteria:
- Observed data can replace an indicator that previously relied on modeled data.
- Modification of a previous indicator can result in (1) a meaningful measure more easily understood by a non-planner, and/or (2) a significant reduction in the level of effort to maintain the data without a proportional reduction in its meaningfulness, and/or (3) an increase in its relevance to plan recommendations.
- A new dataset released with greater frequency can create a more informative, up-to-date performance measure.
For the few plan sections that did not originally identify specific measures, ten new primary indicators have been established. The draft report also introduces a secondary set of nine "kindred indicators" that supplement existing performance measures to tell a more complete story of plan implementation progress moving forward.
Primary and Kindred Indicators
This Policy Update highlights a number of performance measures that were also included in the Moving Forward 2013 GO TO 2040 implementation report; reference the draft Indicator Selection Report at http://cmap.is/1cFBigU for a full summary of plan update indicators.
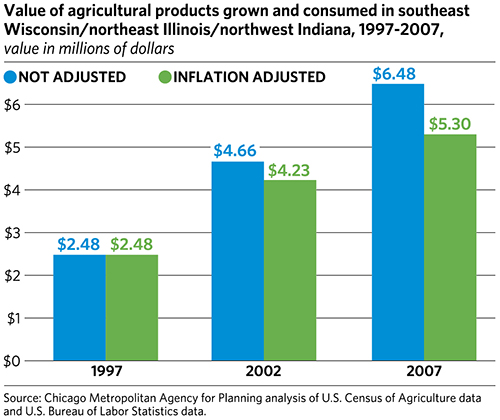
Value of Local Agricultural Products Sold
For the Promote Sustainable Local Food recommendation area, GO TO 2040 originally measured the dollar value of agricultural products produced and sold directly to individuals for human consumption from roadside stands, farmers' markets, etc., in the seven-county region. For the plan update, CMAP will use the same data but adjust it for inflation to show the real (not nominal) value of agricultural products sold. Economic comparisons, especially ones that may cover decades of data, should use real dollars as a basis for comparison – removing the effects of inflation reveals the true growth (or decline) in value, as highlighted in the following chart.
 Click for larger image.
Measuring Economic Innovation
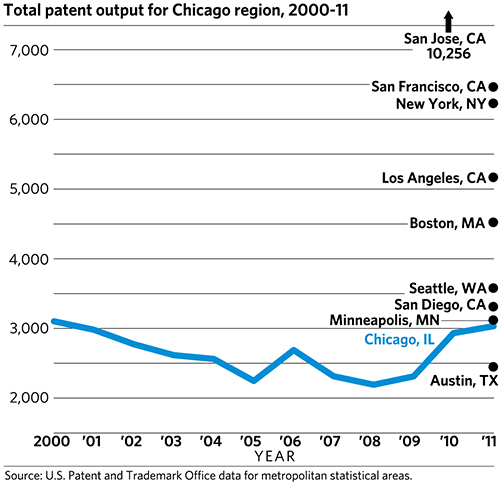
The GO TO 2040 recommendation area Support Economic Innovation did not originally include any primary indicators. The plan update will feature several new primary and kindred performance measures for this recommendation area. For example, private sector employment in research and development is a useful indicator of metropolitan Chicago's performance relative to other regions.

GO TO 2040 recommends linking diverse groups, fostering awareness about local research, providing better training for researchers and entrepreneurs, and targeting public sector investment to help turn research into marketable products. Increasing venture capital investment can enable entrepreneurs and start-up firms to locate and thrive in metropolitan Chicago. The plan update will measure both venture capital funding and the number of patents issued annually to gauge the robustness of innovation in the region.
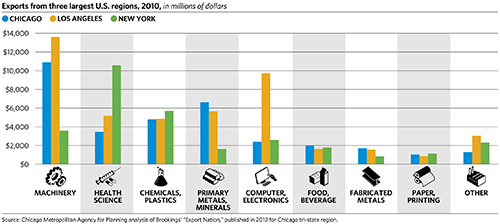
The plan also calls for the region to nurture its industry clusters. As highlighted by CMAP's drill-down report on the cluster, manufacturing has been a key driver of economic growth in metropolitan Chicago, and CMAP will use a kindred indicator on manufacturing exports to assess the health of the industry cluster.
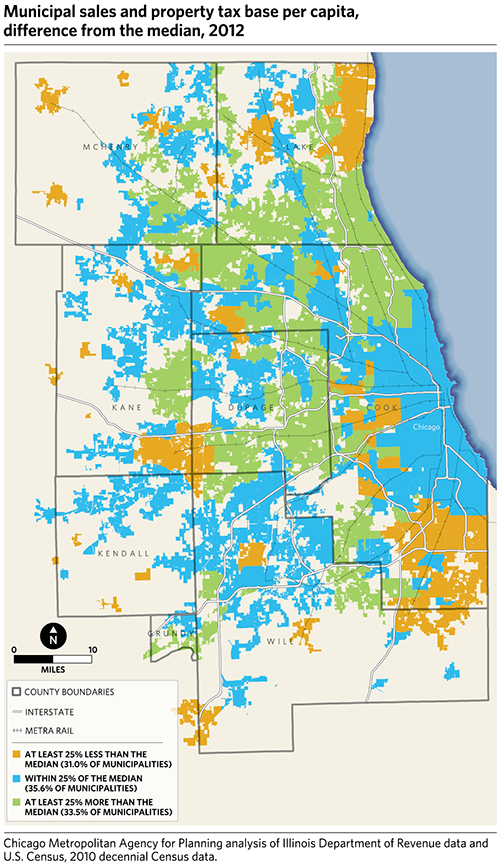
Equity of the Tax System
The GO TO 2040 recommendation Reform State and Local Tax Policy area originally suggested the creation of indicators to track the efficiency, equity, and transparency of the tax system. To measure equity of the tax system, a new plan update indicator will examine the percentage of municipalities with a per capita sales and property tax base of more than 25 percent below the median. Equity is viewed in terms of municipalities' ability to fund necessary services. In 2012, 31 percent of the region's municipalities had per capita tax bases more than 25 percent below the median of $42,322.
Transit Access
The GO TO 2040 recommendation to Increase Commitment to Public Transit emphasizes the need to make transit a better first option, rather than last resort, for more residents. The plan originally measured transit accessibility by the percentages of regional population and jobs within one-quarter mile of a CTA bus stop or Pace bus route, or within a half-mile of a rail station. The indicator was easy to understand but simplistic. In the plan update, CMAP will measure accessibility with an overall index that uses four equally weighted factors:
- Transit service frequency
- Pedestrian environment
- Proximity to nearest transit stop
- Transit connectivity
The following chart is a prototype, as CMAP plans to further refine this measure with input from local partners as the plan update process continues.
