On December 3, 2015, the U.S. Census Bureau released its 2010-2014 American Community Survey (ACS) 5-year estimates. The ACS collects information such as ancestry, educational attainment, income, employment, and housing characteristics and makes this data available at multiple geographic levels, including municipality and township. This release of the ACS marks the first time that users and analysts are able to compare two non-overlapping 5-year ACS datasets (2005-2009 and 2010-2014), and the first time that many of the region's smaller communities will be able to see this change for their jurisdictions. This Policy Update is part of a series that uses the most recent ACS data to examine broad trends in the CMAP region.
GO TO 2040 advocates for a multimodal transportation system that improves regional mobility, reduces congestion, and supports coordinated reinvestment in existing communities, leading to environmentally sensitive and fiscally efficient outcomes. This Policy Update analyzes regional trends in transportation mode share overall and by worker earnings. "Mode share" indicates the proportion of the region's travel that is made on different modes of transportation. Major transportation modes include driving alone (single-occupancy vehicles), carpooling (high-occupancy vehicles), transit, biking, and walking.
Why mode share matters
GO TO 2040 recommends increasing investment in public transit as well as encouraging more walking and biking trips as these modes of travel can alleviate congestion and are less environmentally damaging. Transit helps improve our economy and quality of life, giving people more choices for getting around. A diversified mode share can also increase regional mobility so that driving becomes a choice rather than a necessity.
A shift in travel behavior in the region
After several decades of consistent growth in car ownership, car use, and solo occupancy vehicle (SOV) commuting, travel behavior has shifted significantly since 2000. Through the 1980s and 1990s, the share of commuters driving alone to work steadily increased until these trips represented 70 percent of total work trips. Since 2000, though, the share of SOV trips has stopped increasing. During the same period, the composition of the remaining 30 percent of commute mode share has diversified.

Commuters in the Chicago region appear to be shifting away from carpooling in favor of non-automotive alternatives. A notable trend among these alternatives is the increase of the non-commute category, or telecommuters. This category of commuter has steadily increased since 1980 and comprises 4.5 percent of the region's workers in the 2010-2014 ACS 5-year estimates. Although bicycling represents a small component of overall mode share, this mode saw the greatest increase, more than doubling between 2000 and 2014.
Transit mode share has also changed. The percent of the region's residents commuting by rail has remained steady since the 1990s. However, bus ridership has declined. The decrease occurred from 1980-2000, with mode share near 5 percent since 2000.
Geographic differences in mode share
Commute mode share differs throughout the region, with the exception of a broad dependence on SOV commuting. The City of Chicago's high population density, status as the region's employment center, and extensive public transportation network make it an outlier, with much higher rates of public transit use, bicycling, and walking than the rest of the seven-county region. In the City of Chicago, only half of commuters drove alone to work in the 2010-2014 dataset with commuting by bus as the next most common mode.

For the suburban areas of the region, carpooling is the second most predominant commute mode, with commuter rail transit and working from home alternating for third and fourth. Commuter rail is the prevailing transit mode outside of the City of Chicago, particularly in townships near Metra rail lines. Mode share for all types of rail transit are highest in the City of Chicago, Suburban Cook, and DuPage County, at 12.9 percent, 6.4 percent, and 6 percent, respectively. Lake County has a lower rate of SOV commuting than most other areas of the region, driven by a notably high percent of commuters who walk to work, as well as the largest percent of residents working from home. Lake County also experienced the largest percentage point increase in residents working from home between 2000 and 2010-2014.

The effect of worker earnings
Commute patterns also vary by worker earnings. Trends in SOV commuting are particularly striking. While the majority of commuters across all wage levels drive alone to work, the rate of SOV commuting rises with wages, levels off, and decreases for the highest earners. This pattern is consistent across the region's seven counties.
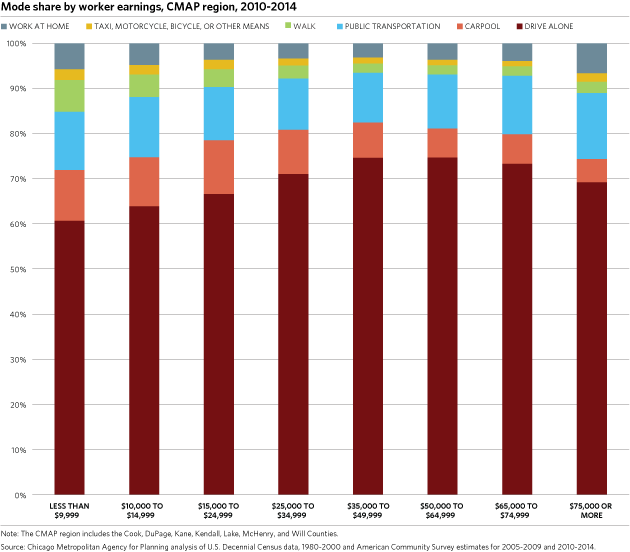
While the incidence of carpooling decreases as earnings rise, the relationship between public transportation mode share and earnings is not as linear. The region's highest and lowest earners have a larger public transportation mode share than the region's middle earners. Similarly, the share of people working from home is highest for those earning less than $10,000 or more than $75,000 annually. The region's highest earners, those making more than $75,000 annually, have the largest mode share of public transit at 14.6 percent. In suburban areas, less than 5 percent of those earning less than $50,000 annually use public transit, though in the City of Chicago those earning less than $15,000 annually were the most frequent transit users.
It is possible that high wage jobs are more concentrated in dense areas with better access to transit, or that high earners choose to live in areas with better access to public transportation options than low and moderate earners. These high earners are predominantly "choice" riders of transit who could drive if necessary.
Mode choice depends on variables such as travel time, cost, and level of service. Income plays a role as well, with factors such as vehicle availability or the desire for a shorter commute somewhat driven by worker earnings. Regional mode share may be attributed these factors plus issues of regional accessibility and connectivity, often influenced by land use. The balance between densities of population and employment in conjunction with access to transportation infrastructure and ease of travel may play a larger role in explaining regional mode share trends. Other trends, such as the recent increase in commuting via bicycling and working from home, may be attributed to lifestyle choices and increased infrastructure for these modes along with other factors.
Looking ahead
As indicated in GO TO 2040, investment in regional mobility supports a strong quality of life and long-term economic productivity. Diversifying mode share in the region by expanding transportation options can increase the efficient movement of goods and people, offering choices to the region's residents and reducing the negative impacts of congestion. It may serve as an investment in human capital, and attracting skilled workers, who value a well-functioning transportation network.
Understanding changing trends in mode share is also important to help communities plan to support their residents' needs. In preparation for CMAP's next comprehensive regional plan, the upcoming transportation network and trends snapshot will further assess progress on existing GO TO 2040 indicators as well as document travel behavior trends, summarize system characteristics and performance, and document historical transportation funding trends.