Rising levels of housing vacancies in metropolitan Chicago suggest both challenges and opportunities, especially for the region's local governments. Vacant units may create the need for additional public services to maintain properties while simultaneously contributing less to the local property tax base. However, vacant properties may also provide an opportunity to pursue infill and redevelopment projects to more appropriately match housing and transportation needs, provide access to jobs, and build on existing infrastructure. GO TO 2040 identifies 75,000 acres of residential land within existing municipal boundaries that are considered vacant and/or "underutilized" and calls for redeveloping 20,000 acres of underutilized residential and commercial land by 2015.
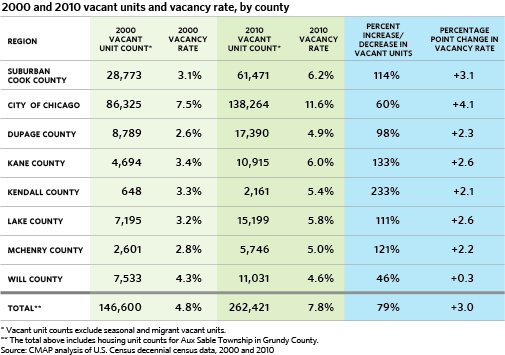
On August 4, 2011, the U.S. Census Bureau released additional 2010 decennial census data for Illinois, providing more details than were available with the redistricting data released earlier this year. The data shows that the number of vacant units as well as overall vacancy rates grew region-wide by 79 percent relative to 2000, rising from 146,600 to 262,421 units. This vacant unit count includes rental and owner-occupied housing units and excludes seasonal and migrant vacant units. While vacant unit counts and vacancy rates are highest in Chicago and suburban Cook County, the total of vacant units increased fastest in Kendall, which is also the region's most-rapidly growing county. Will County, which was the second-fastest growing county in the region, shows the smallest overall increase in vacancy rates, with a minimal increase of 0.4%. The map below depicts vacancy rates by township for the region. Townships in the darkest orange have vacancy rates above the regional average.

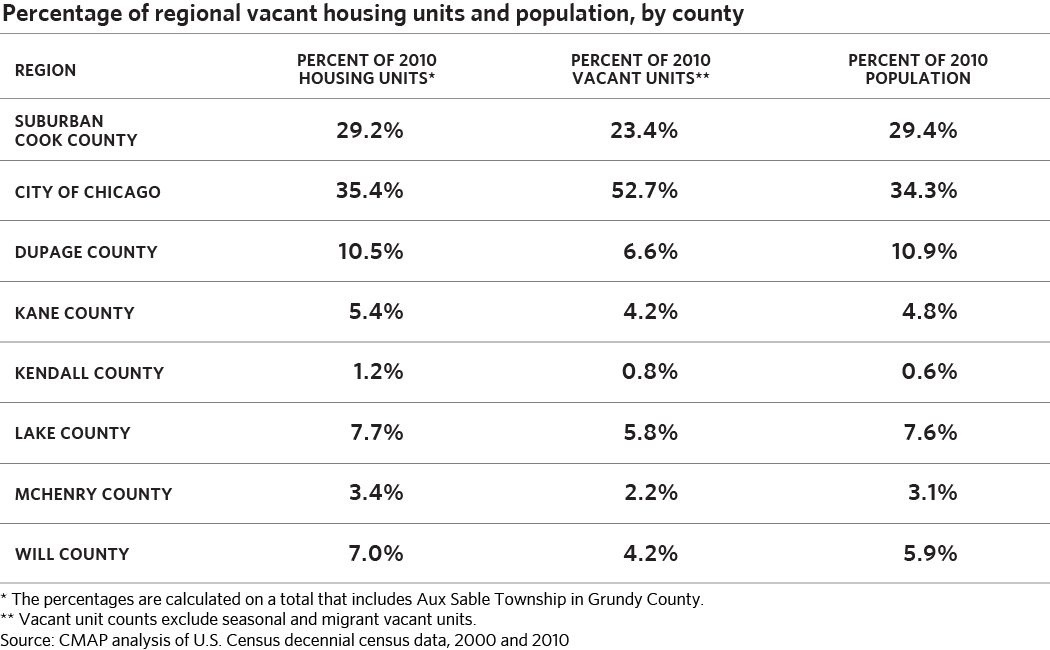
The City of Chicago contains a disproportionate share of the region's vacant housing units, about 51 percent, compared to a 35 percent share of total housing units and 34 percent share of total population. Suburban Cook County, however, contains a comparatively smaller share of total vacant units given its population, with 23 percent of total vacant units versus 29 percent of both total housing units and total population. Each other county's share of the region's vacant units is equivalent to or smaller than its share of the region's population. The table below outlines each county's share of total housing units, vacant housing units, and population.
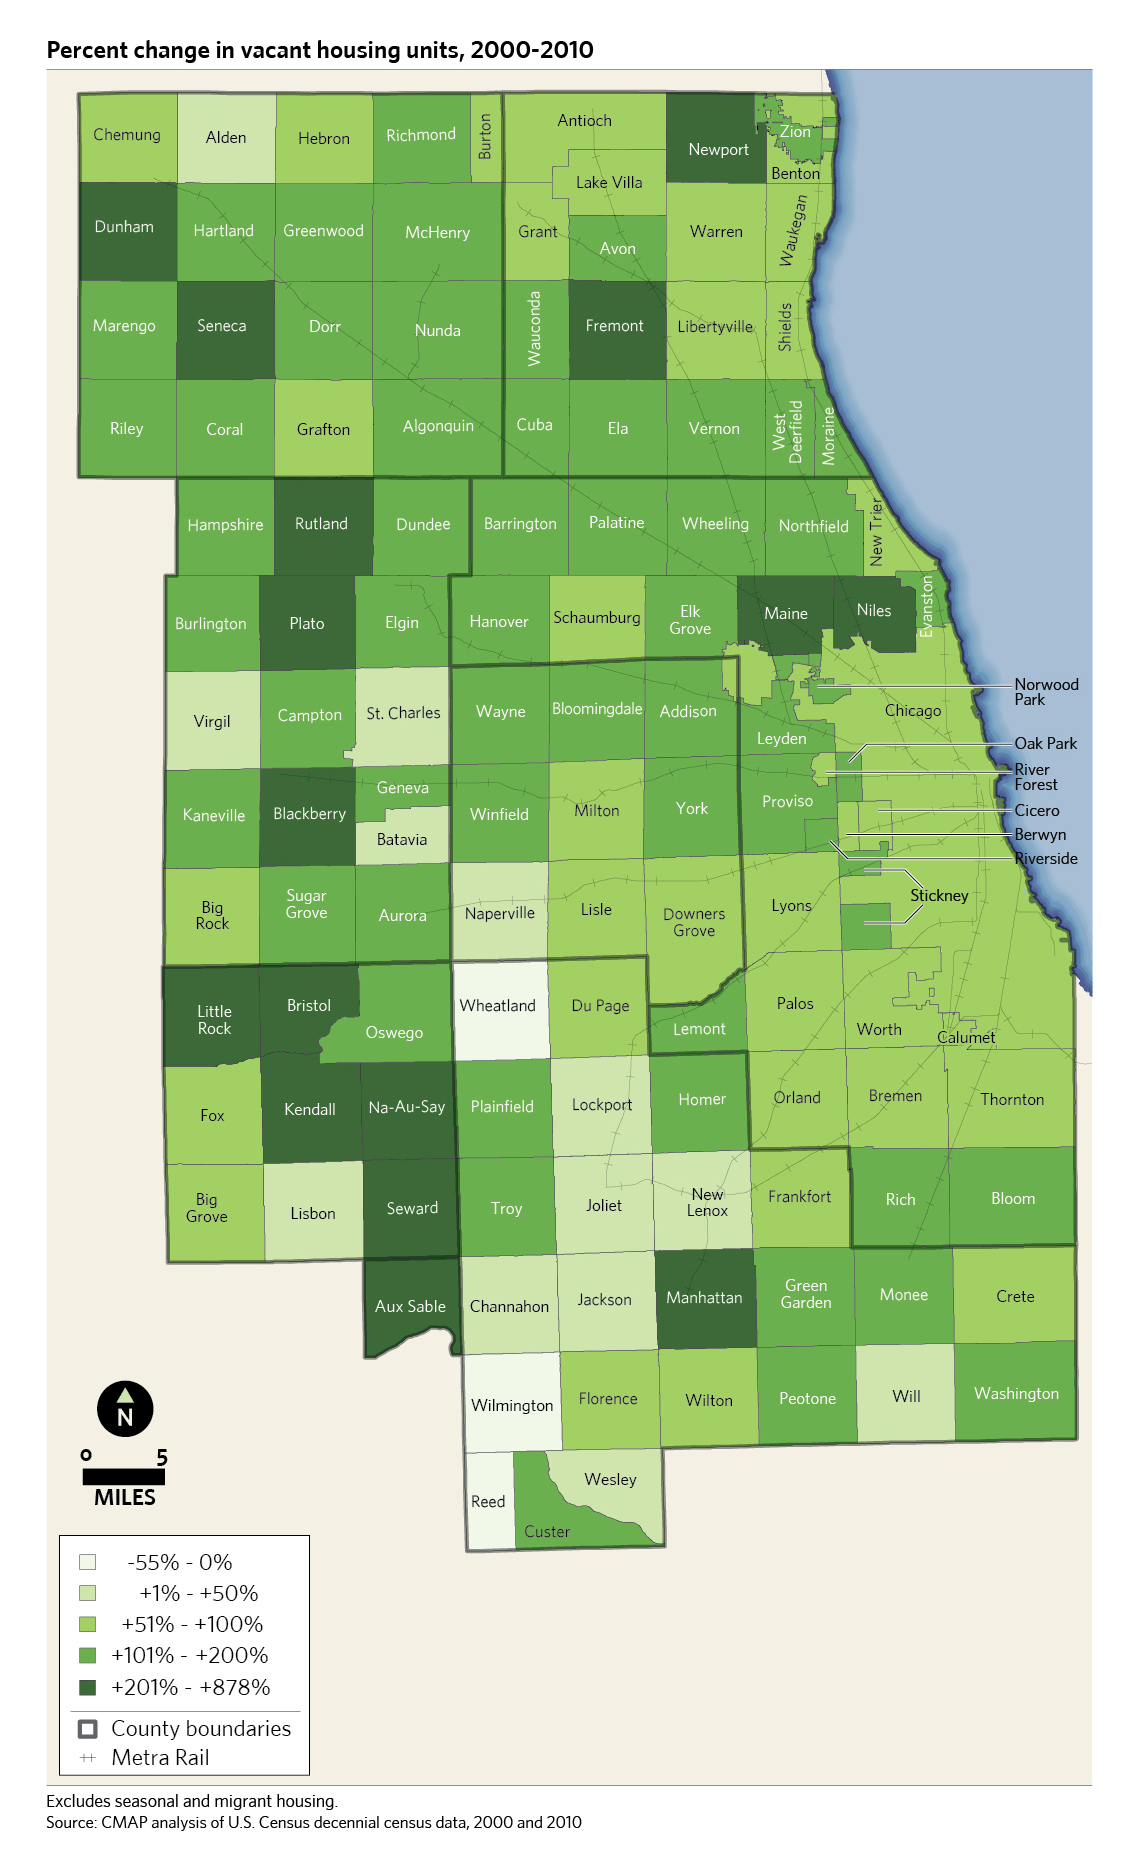
The following map shows growth in vacant housing units by township during the past decade. The number of vacant units more than doubled in over 20 townships, located in both inner and outer suburban areas. In fast-growing townships in the collar counties, the growth in vacant units likely reflects the overall growth in housing units during this period. Note the exception of Will County, where the county as a whole and most townships recorded a decline in vacant units over the past decade. However, most of the high-growth townships in Will County also experienced increases in vacant units, following the trend in other collar counties.
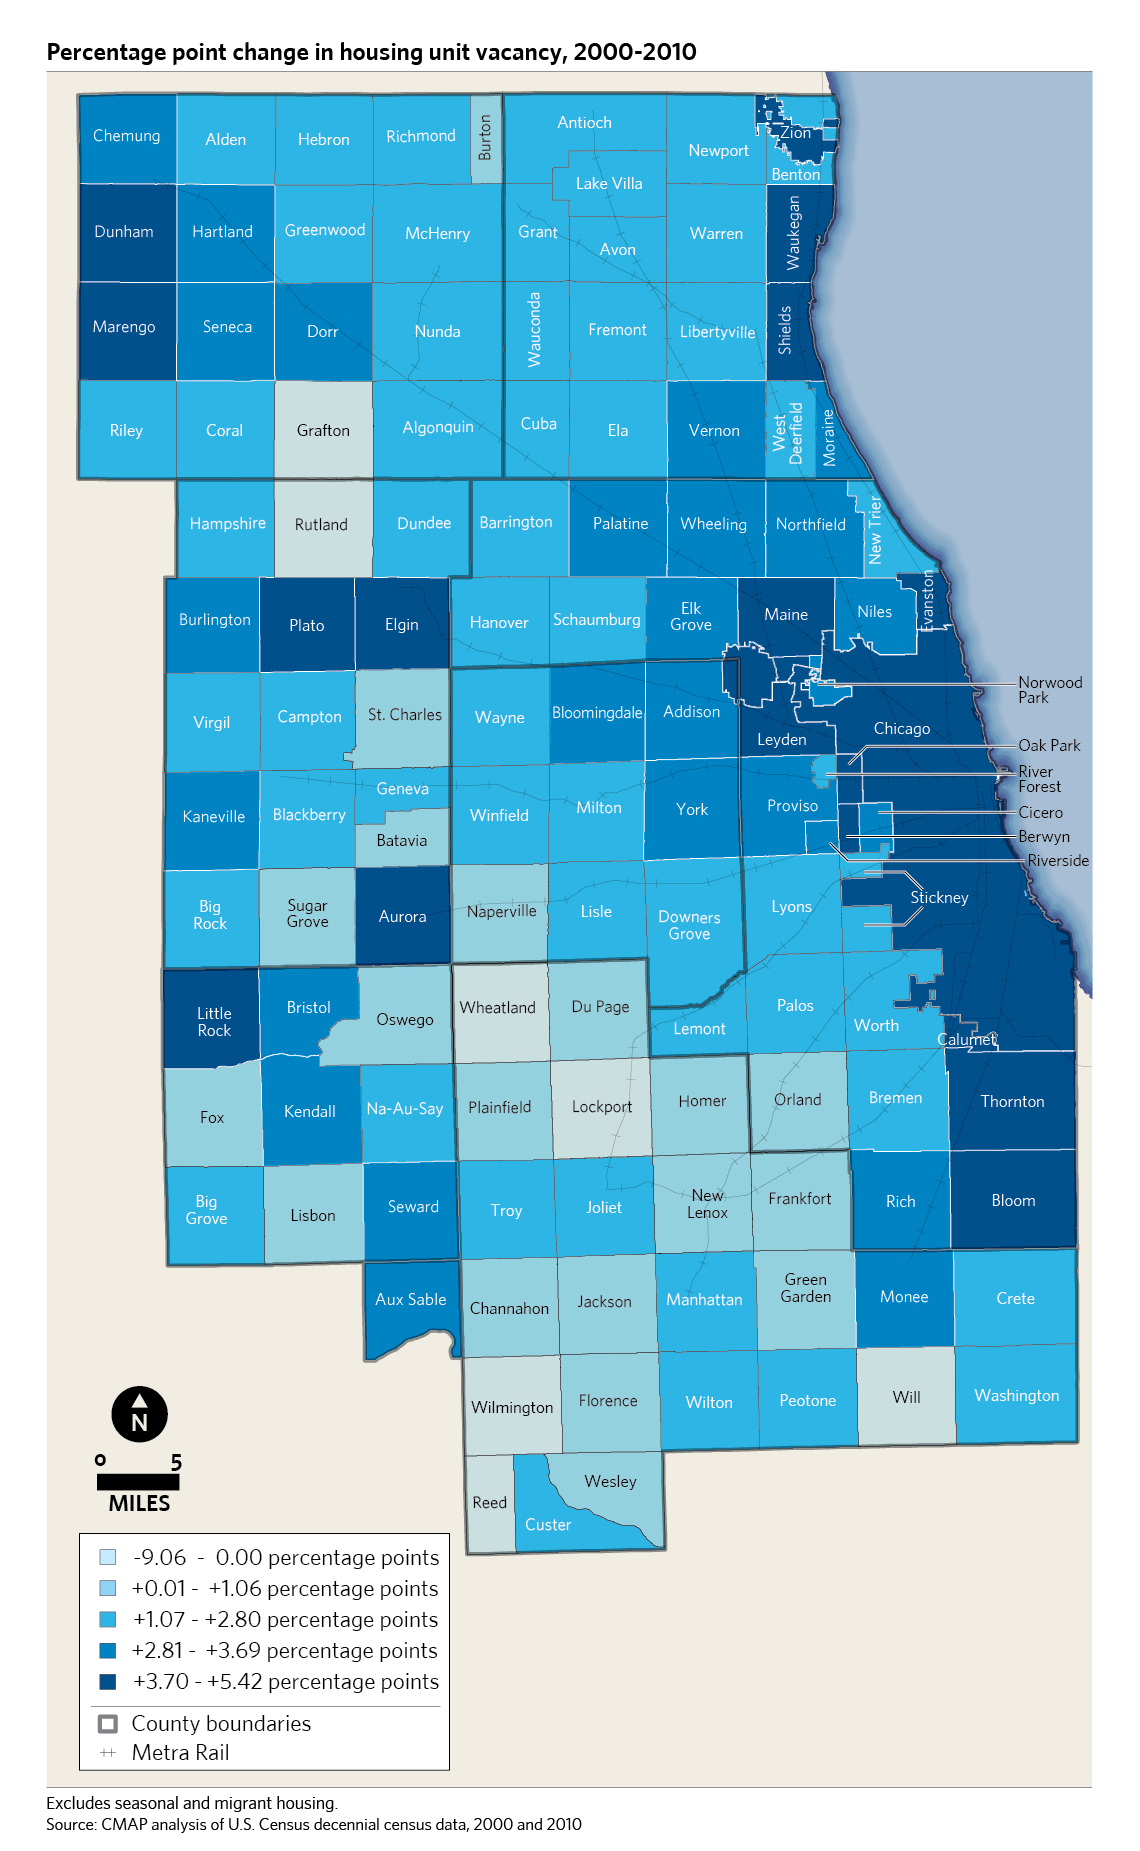
The following final map shows the percentage-point growth in the share of vacant housing by township. As noted above, vacancy rates have generally increased across the region. This trend is seen in both owner-occupied and rental units. However, the City of Chicago maintained an essentially constant vacancy rate (7.5 percent to 7.6 percent). Most townships in Will County, as well as several townships in McHenry, Kane, and Kendall Counties, also saw vacancy rates decline over the past several years. However, several other townships in those same three counties saw substantial growth in vacancy rates, as did five inner ring townships in Cook County and one township in DuPage County.