Metropolitan Chicago's rail network plays a key role in moving goods and people throughout the region and nation. Approximately one-quarter of all freight trains and one-half of all intermodal trains in the nation pass through Chicago, which serves as the continent's main interchange point between western and eastern railroads. Rail is a key part of the regional economy, directly employing nearly 12,000 people in the seven-county CMAP region in 2014 and indirectly supporting an additional 26,000 jobs.
The Chicago region contains an extensive freight rail network, handling the movement of 1,300 trains each day, including 500 freight and 760 passenger trains for a total of 37,500 railcars. The region contains an estimated 3,865 track-miles of rail -- greater mileage than nearly 40 other states -- as well as both passenger and freight rail facilities, including more than 50 freight rail yards. Nearly 1,400 of the region's track-miles are shared by both passenger and freight trains. The density of the rail network here provides unparalleled opportunities to make connections among the railroads, as well as connections to trucking and other modes, providing choices and access to markets for shippers in our region.
However, this concentration of rail activity presents some challenges to the region, such as causing motorist delay at highway-rail grade crossings, transit delays where freight and passenger trains share track, and a reduction in speeds and productivity as trains navigate our region's congested rail network. The last in a series of three on air, water, and freight activity in the region, this Policy Update reviews the performance of the rail system, both at the national level and, when data permits, within northeastern Illinois. It also reviews major trends facing the industry, namely the effects of federal deregulation and the changing composition of rail traffic, as well as recent initiatives to improve the metropolitan Chicago rail system.
National freight rail trends
The rail industry has undergone fairly dramatic changes in the past 35 years. The Staggers Rail Act of 1980 deregulated the railroad industry, including the mechanisms for railroads to set prices for their services. Since deregulation, the rail industry's productivity has improved substantially, increasing volumes and revenues while offering lower rates for shippers. According to the Association of American Railroads (AAR), the improved financial position of the railroads has allowed the industry to reinvest substantial capital into the rail network, totaling $575 billion since 1980. Better infrastructure, along with increased safety regulations, contributed to a greatly improved industry safety record, with the number of train accidents down 80 percent since 1980.
Total rail traffic for the seven U.S. Class I railroads -- the nation's largest railroads -- has been relatively constant over the past 10 years. According to AAR data, volumes have fluctuated between 1.6 and 2 billion tons over that period, with a notable decline in 2009 during the recession. However, the composition of this traffic appears to be changing.
Two major components of freight rail traffic are carloads and intermodal trains. Carload services are typically trains consisting of a variety of railcars and commodities, each car potentially coming from a different shipper and with different destinations. Carload trains may provide services to small or large shippers and receivers, typically situated along rail sidings to facilitate all-steel-wheel delivery. In contrast, intermodal services are trains carrying containers or trailers. Containers are carried in "well cars," frequently stacked two-high. Trailers are carried on flat cars. As described in a recent Policy Update, intermodal services provide more line-haul services between key nodes in the network.
Since 2000, intermodal traffic among the Class I railroads has grown fairly steadily, aside from a decrease during the recent recession. Intermodal volumes through 2014 have exceeded pre-recession levels. In contrast, carload traffic held steady during the first half of the 2000s, but it declined with the recession and has not returned to pre-recession levels. In 2000, carload traffic exceeded intermodal traffic by a considerable margin, almost doubling intermodal levels. However, in 2015, traffic levels between carload and intermodal traffic had reached parity.

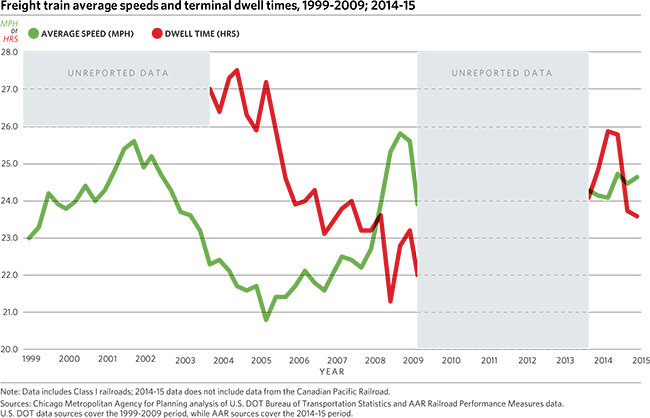
Some data is also available on the speed of the nation's freight rail system, usually described as average speeds and terminal dwell times. Average speeds refer to travel along rail lines, not including time spent in storage yards or making pickups or deliveries, while terminal dwell times refer to the time a car spends at a rail yard. Average speeds have trended up slightly in recent months, although they are still below pre-recession levels. Terminal dwell times increased over the past winter but have since dropped fairly dramatically and are currently approaching pre-recession levels. The chart's gaps are due to lack of publicly available data.
Availability of Freight Rail Data
In general, publicly available data that describe freight rail infrastructure, cargo, and movements is extremely limited, even at the national level, as evidenced by the previous chart. But new, more detailed data sources are becoming available, providing additional insight into the performance of freight rail.
In 2014, the Surface Transportation Board (STB), the economic oversight body for freight railroads, ruled that all seven Class I railroads must report weekly data to "promote industry-wide transparency, accountability, and improvements in rail service." This ruling was made in response to major service issues experienced during the 2013-14 winter, in which grain shipments in particular saw massive backlogs due to harsh weather conditions and a lack of coordination among the various carriers.
For each carrier, the new STB dataset includes nationwide average rail speeds and terminal dwell times, as well as terminal dwell times for the ten largest railcar yards. This data is similar to the data carriers have been voluntarily providing to the Association of American Railroads (AAR) for more than a decade, though the STB data additionally breaks down speeds and dwell times by the type of goods trains are carrying.
The STB ruling also requires the Chicago Transportation Coordination Office (CTCO) to report data weekly. The CTCO is a consortium composed of the major railroads in the Chicago region, with the goal of improving coordination and communication among railroads. The CTCO reporting for the first time establishes a publicly available dataset specific to the Chicago region, providing average daily number of cars in the 11 largest rail yards in the region, the number of trains held for delivery to yards in metropolitan Chicago by carrier, and operating conditions for the region. The CTCO data reporting does not include intermodal yards.
Of the yards included in the CTCO dataset, the Clearing Yard in southwest suburban Cook County is the busiest, handling some 3,500 cars each day. The Proviso Yard in west suburban Cook County is the second busiest, handling about 2,500 cars each day, with the remaining yards varying between volumes of 500-1,500 rail cars handled daily. The Clearing Yard is owned by the Belt Railway of Chicago, a terminal railroad co-owned by the Class I railroads and providing switching services among them.
The new STB data has shortcomings. It has only been reported since October 2014; the lack of a long-term data series currently limits our ability to separate any seasonal variations, unusual weather affects, or other data outliers. Its terminal-specific data focuses on a relatively small subset of terminals, and does not include data on intermodal terminals. The national reporting by Class I's fails to capture many yards in the Chicago region, and the CTCO reporting only includes 11 of the more than 50 terminals in the region. Further, the CTCO reporting provides no indication of operating speeds within our region. Nevertheless, the new STB reporting requirements still lend new, additional insight into rail performance. CMAP will continue to monitor and utilize this data to assist with planning for the region's freight network, leading to a better understanding of key barometers -- namely speeds and volumes -- of freight rail traffic in the region.
Mitigating congestion and delay
As volumes have increased throughout the system so has congestion and its negative effects. Congestion occurs on rail lines for a variety of reasons: Volumes may exceed the capacity of a given line, intersecting lines may cause trains to be delayed while waiting for another train to pass, or operational and regulatory restrictions may cause delays. For instance, federal laws regulate the number of consecutive and monthly hours train crews may work, and so delay can occur if crew members have met their hours-of-service levels and are not replaced with new crews. Unexpected external events such as weather may also have a large effect on freight train operations.
The nation's rail problems are compounded in metropolitan Chicago; as the nation's rail hub, the region both contributes to and is affected by the industry's fluctuations. And with almost all major railroads converging in Chicago, congestion problems are compounded in the region and cause nationwide ripple effects in the supply chain. The importance of the Chicago region's rail hub, and the need to address congestion issues there, featured prominently in STB public hearings held in April 2014 and September 2014.
There are several private and public-private initiatives underway or recently completed to increase capacity and efficiency of the region's rail network. The most prominent of these is the Chicago Region Environmental and Transportation Efficiency Program, or CREATE, a multi-billion dollar public-private partnership to expand the Chicago rail network's capacity, separate passenger and freight rail lines, reduce the number of at-grade crossings between railroads and highways, and better coordinate operations. As of July 2015, 23 of the 70 planned CREATE projects in the region have been completed. To date, the program has reduced the amount of time it takes a manifest or intermodal train to pass through the region from an estimated 48 to 32 hours, and the program's estimated economic impacts total $28.3 billion.
Additionally, some carriers have taken steps to avoid congestion in metropolitan Chicago. For example, the Canadian National (CN) railroad purchased the Elgin, Joliet and Eastern Railway line (EJ&E) in 2009, allowing CN to reroute trains outside and around downtown Chicago. This allows the carrier to divert approximately 6,000 cars per day out of the heavily congested downtown rail lines. CMAP estimates that half of all freight traffic in the region is simply through-traffic, making diversion around downtown a potentially attractive way to reduce rail congestion. But the CREATE program offers additional opportunities to reduce congestion within the heart of the region's rail system, through grade separations and capacity improvements.
Improving freight operations is another tactic being employed to mitigate congestion in the region. The CTCO is a regional entity through which the private railroads have agreed to coordinate operations under certain conditions. The private railroads jointly staff the CTCO and monitor key performance measures for the regional rail system. Inclement weather, unscheduled maintenance, or other events affecting operating conditions trigger greater communication and cooperation between the major railroads. Operational improvements, such as joint dispatching, were a key recommendation in the newly released Chicago Gateway Blue Ribbon Panel report. Amtrak convened this panel in late 2014 to address rail congestion in the Chicago region.
Looking Ahead
GO TO 2040 calls on the region to create a more efficient freight network and identifies a number of specific implementation actions centered on the rail and highway systems. The newly available information from the STB, including the new Chicago-specific reporting required of the CTCO, better positions the region to develop a strong, multimodal freight plan. Robust freight planning is key to support the long-term health of the region's freight cluster and, by extension, the regional economy.
Though the newly available data provides a good start, better and more complete data is necessary to more completely understand the performance of the regional freight system. To that end, CMAP staff will continue to collect and assemble weekly reported data to gain a greater understanding of national and regional rail trends over time, while continuing to seek new sources of data to support regional planning efforts.