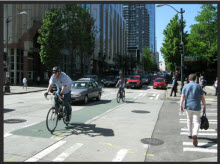
 Traditional bike maps and analysis tools don't always tell the whole story. A free webinar on Friday, February 27 from 11:00 a.m. to noon CT will teach attendees a new way to map routes and visualize a network's completeness, and explain how clients and communities can benefit from this new approach. Participants will learn the basics of stress level mapping, how to apply it using available data, and how it can contribute to a network analysis. Advance registration is required.
Why make bicycle stress maps? Typical bike maps don't convey the comfort of routes or how far a bicyclist can ride before encountering a high-stress location. To attract new riders -- many of whom are only willing to ride on routes they perceive as comfortable and low stress -- we need maps and tools to communicate that information. Bicycle stress level maps represent a highly effective, visual means to encourage cycling for all ages and abilities and to identify high-stress segments where bikeway upgrades are needed.
Presenters include:
- Vig Krishnamurthy, Transportation Planner and Designer, Sam Schwartz Engineering, Chicago
- Ben Rosenblatt, Transportation Planner, Sam Schwartz Engineering, New York
Advance registration is required.