In northeastern Illinois, household income growth has not kept pace with overall inflation and has been unevenly distributed across the region. Understanding income growth patterns can help decision makers address quality-of-life, economic development, and fiscal issues across the metropolitan region. This Policy Update will examine current household income patterns in northeastern Illinois, as well as changes since the 2000 decennial census. The following analysis uses household income estimates from the U.S. Census Bureau's American Community Survey (ACS) based on samples from 2007 to 2011.
The Census Bureau's 2007-11 ACS five-year estimates show that the region's households have $259.6 billion in annual household income (in 2011 dollars), representing a 28.5 percent increase from the 2000 decennial census (aggregate household income of $202.0 billion in 1999 dollars). This did not keep pace with national growth trends over the same time frame, where aggregate household income increased 39.3 percent and the consumer price index for all urban consumers increased 35.0 percent. The CMAP region experienced a 20.3 percent increase in median household income (MHI) from $52,429 in 1999 to $63,054 in the 2007-11 ACS estimate (in 2011 dollars).
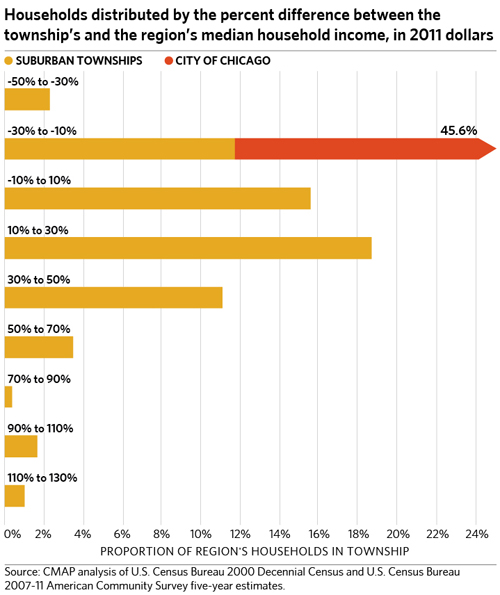
In the 2007-11 ACS estimate, the MHIs of 25 of the region's 125 townships (including Chicago) were within 10 percent of the $63,054 derived regional MHI. Households living in these townships account for 15.6 percent of the region's total households. Townships are not equally distributed in terms of divergence from the regional MHI. More households live in townships where MHI is 30 percent greater than the regional MHI, in contrast to townships where the MHI is 30 percent less than the regional MHI. The following chart shows the households in each township as a proportion of the total households in the region, distributed by the percent difference between the township's MHI and the derived regional MHI.
Among the region's townships, 47 townships saw increases in MHI that were higher than the derived regional increase of 20.3 percent. Of these townships, the vast majority of them also had MHIs above the derived regional MHI in the 2007-11 estimate (shown in blue in the map below). Just three townships experienced higher MHI growth but still had lower MHI than the regional MHI in the 2007-11 estimate (shown in green in the map below). Among the 78 townships that experienced lower MHI change than the region as a whole, 26 townships had MHIs less than the regional MHI (shown in brown in the map below). For about two-thirds of these low-MHI and low-change townships, MHI in 1999 was also lower than the regional MHI.
With the exception of Chicago and a couple of small suburbs, Cook County experienced a lower percent change in MHI than the region as a whole. DuPage County also experienced low growth in MHI. However, DuPage County's MHI remains higher than the region as a whole despite its lower growth, while many Cook County suburban areas have lower MHI than the region as a whole. With a couple exceptions in Chicago's inner-ring suburbs, most of the higher income and higher growth townships were located in the outer areas of the region in Kane, Kendall, Lake, McHenry, and Will Counties. The following map illustrates patterns in MHI by township between 1999 and 2011.

Click for larger image.
These higher income and higher growth townships also experienced more population growth than the rest of the region between 2000 and 2010. Based on analysis of 2000 and 2010 decennial census data, these townships increased population by 29.8 percent in the aggregate. By contrast, the 26 low-change and low-income townships grew by 1.5 percent in the aggregate and the 52 low-change and high-income townships grew by 7.7 percent in the aggregate.
Conclusion
It is clear that household incomes in many parts of northeastern Illinois are falling behind the rest of the region, as well as the rest of the U.S. Many of these communities are also experiencing relatively low population growth or even population declines. These demographic patterns tend to discourage economic development in the very areas that need it most.