Over the next year, a series of three Policy Updates will build on the Regional Economic Indicators project to analyze freight flows, trends, and challenges in the Chicago region. This post provides data on freight flows into and out of metropolitan Chicago, as well as projections of future regional freight flows. The second post will discuss intermodalism as a rising trend in Chicago's freight industry. The final post will explore the key challenges to Chicago's freight cluster and efforts underway to address these challenges.
Freight has long been central to the development of metropolitan Chicago. An unmatched combination of transportation modes and infrastructure has contributed to the region's position as a hub for both domestic and international freight transportation. Over 925 million tons of freight worth $1.3 trillion move directly into and out of the Chicago region each year, underpinning a national freight system that drives economic growth. According to CMAP analysis, the region's freight cluster directly supports 176,000 jobs in northeastern Illinois. The region's freight cluster is a quickly-growing component of the regional economy. The cluster has added nearly 17,000 jobs in the seven-county region since 2010, and jobs in the cluster pay an average of $70,000 per year. Growth in the cluster capitalizes on the region's extensive freight infrastructure, including seven interstate highways and six of the seven Class I railroads -- more than any other area in the U.S -- and O'Hare International airport, one of the world's busiest. This Policy Update provides an overview of goods movement to and from the region and discusses future trends for freight flows in the Chicago region.
Chicago region inbound and outbound freight by mode, 2012| | Truck | Rail | Air |
| Tonnage | 702.7 million | 67.5 million | 0.7 million |
| Value | $911,159 million | $35,981 million | $55,344 million |
| $/ton | $1,297 | $533 | $80,194 |
Source: Chicago Metropolitan Agency for Planning analysis of 2012 Freight Analysis Framework data.Note: The chart does not include freight moved by water, pipeline, and other modes, which cover approximately 17 percent of inbound and outbound freight movements by weight and 22 percent by value.This policy update based on the latest Federal Highway Administration Freight Analysis Framework (FAF) data regarding freight commodity movements (called "flows") by truck, rail, and air. The Federal Highway Administration provides the FAF to estimate the volume and value of freight moving between metropolitan and non-metropolitan areas. The FAF zone for Chicago includes the CMAP seven-county region, along with neighboring Grundy, Kankakee, and DeKalb counties. The FAF estimates focus on freight movements into and out of the region, but excludes through traffic that does not stop within the region as well as freight movements solely within the region.
This work updates and expands upon the 2007 FAF data reported in the
Freight Cluster Drill-Down Report to provide recent and projected information on freight flows in the region.
Chicago region change in freight tonnage by mode, 2007-12| | Inbound | Outbound |
| Truck | -1% | -1% |
| Rail | 5% | 18% |
| Air | 13% | 30% |
Comparison of 2007 and 2012 FAF inbound and outbound flows show a decrease in trucking, which moves the majority of freight by tonnage and value, indicating that the region continues its recovery from the Great Recession. The reduction in trucking flows and increases in rail and air utilization may also reflect other shifts in industry and market demand.
Truck
Trucking is the most versatile of all freight modes. Trucks can transport goods regionally or long distances and play a critical role in local delivery as the mode of choice for first- and last-mile distribution. More goods travel by truck in metropolitan Chicago than by all other modes combined. According to the 2012 FAF estimates, over 76 percent of all the tonnage and 71 percent of the total value of commodities shipped to and from the Chicago FAF region are shipped via truck. Regional trucking volumes in 2012 totaled 343 million tons outbound and 359 million tons inbound. The relative parity between inbound and outbound traffic suggests that Chicago is equally a place of both consumption and production.
Nearly 60 percent of goods moving into and out of the FAF region originate or are destined for a location within the state. In fact, truck origins and destinations are highly concentrated -- about 75 percent of the value of freight shipped by truck comes from or goes to just five states. While most of these states are Midwestern neighbors, California is also a top origin and destination for the region's freight flows. This is likely due to California's large population and economy, and also to the outsize role of the Ports of
Los Angeles and
Long Beach in the nation's supply chain. These two ports are the largest U.S. gateway for container traffic, accounting for
a fourth of all container traffic.

By value, the largest commodities shipped into and out of the metropolitan Chicago FAF region by truck include machinery, electronics,
mixed freight (e.g., food, office supplies, hardware), pharmaceuticals, and petroleum. These commodities reflect many goods produced by the
region's manufacturing cluster. Machinery, electronics, and pharmaceutical manufacturing are three of the region's greatest manufacturing strengths.
Rail
Chicago is home to six of the seven Class I railroads, the only location in the country served by so many major railroads. Short-haul lines such as the Burlington Junction Railway or the Iowa Interstate Railroad are also active in the region. Nationwide, rail traffic is highly concentrated on Class I railroads, making Chicago the nation's premier rail hub. According to 2012 FAF estimates, annual regional rail volumes totaled 24 million tons outbound and 42 million tons inbound. These numbers may underrepresent the totality of the region's rail activity, because the FAF does not account for the significant number of through movements in the region. In fact, CMAP estimates that nearly half of all freight in the region is through traffic.

CMAP's Freight-Manufacturing Nexus Report notes that rail has a competitive advantage over other modes for bulky, low-value goods shipped over longer distances. The top five major rail origins and destinations by tonnage are Wyoming, Texas, Illinois, Washington, and Wisconsin, reflecting this focus on long-haul travel. Typically, freight by rail moves more slowly than by truck, but this makes it more affordable to ship goods that do not need to have a "just-in-time" delivery. The major commodities shipped by rail to and from the Chicago region by value include basic chemicals, coal, fertilizers, plastics and rubber, and electronics.
Air
Despite its low volumes, air freight accounts for $55 billion in cargo value -- higher than that of rail. Air freight tends to move lightweight, high-value goods; the region's air freight value per ton is nearly 62 times that of truck and 150 times that of rail. Air freight is also the region's only direct gateway for international goods. While air freight comprises a small proportion of the Chicago FAF region's total freight tonnage and value, this mode still plays a large role in moving freight on a national scale. According to the Federal Aviation Administration, in 2013 O'Hare International Airport was the nation's
fourth-busiest air cargo gateway in terms of total landed pounds.
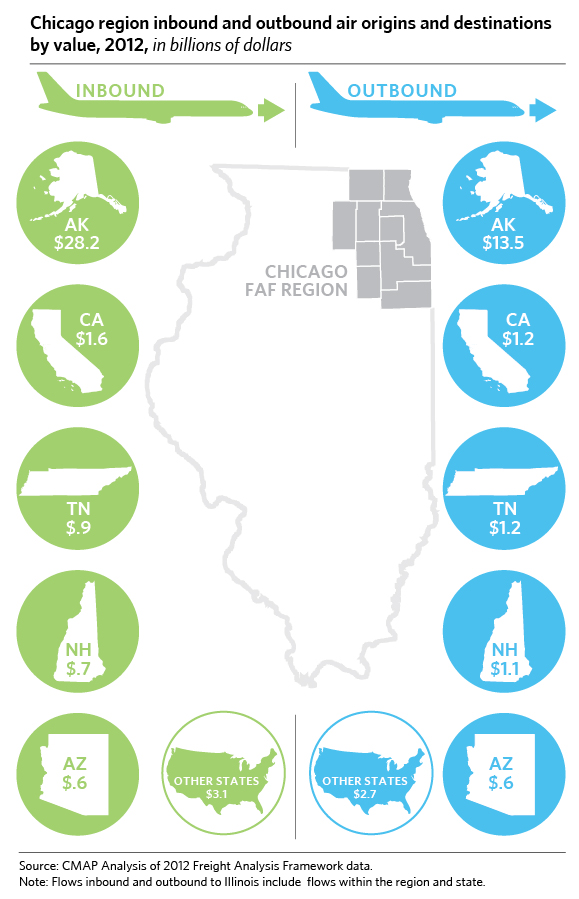
According to 2012 FAF estimates, annual regional air volumes totaled 300,000 tons outbound and 400,000 tons inbound, or $21 billion outbound and $35 billion inbound. Unlike other freight modes, major origins and destinations for air freight are all outside of the Midwest. Alaska is the largest origin and destination for air freight; Anchorage is a common stopover location for goods headed to and from East Asia.
The largest commodities by value shipped in and out of the Chicago region by air are electronics, machinery, precision instruments, pharmaceuticals, and basic chemicals. There is a large disparity between the value of inbound and outbound goods shipped by air, suggesting that the Chicago region is importing more high-value goods, such as electronics, by air from Asia.
Projected Growth in Freight Flows
Although the region experienced some declines in truck flows between 2007 and 2012, freight activity is expected to grow over the long term with the rising importance of trade to the global economy. The FAF estimates that, between 2012 and 2040, the Chicago region will grow from shipping over 935 million tons of freight worth $1.3 trillion to 1.4 billion tons worth $3 trillion. This growth in freight may strain our infrastructure, emphasizing the need for continued investment in the freight system.
Chicago region inbound and outbound growth in tonnage by mode, 2012 and projected 2040| Inbound | Projected Percent Growth by 2040 | Outbound | Projected Percent Growth by 2040 |
| Truck | 58% | Truck | 38% |
| Rail | 55% | Rail | 147% |
| Air | 190% | Air | 301% |
Despite being the smallest mode by weight, air freight in the region is predicted to experience significant growth in the next 30 years. By 2040, the volume of domestic air freight moving in and out of the region is projected to increase by 255 percent, far outpacing the growth in truck or rail shipments. In contrast, overall rail volumes are projected to increase 114 percent and truck volumes to increase by 48 percent. Given the substantial tonnage and values currently shipped via these modes, this also represents a large potential increase in freight vehicles utilizing the region's rail and road infrastructure.
Rail has the second largest projected growth by tonnage, which may reflect the increasing importance of reliable travel times and fuel efficiency. Because rail operates on its own right of way, its performance is unaffected by the anticipated growth in highway traffic congestion. However, trucking will likely continue to play a dominant and prominent role in the freight cluster because it currently provides the best way to ship goods shorter distances and through the first-and-last mile.
The Chicago FAF region's exports and imports to international ports are also projected to increase by 127 percent by 2040. Growth in international trade volumes is projected to far outstrip the growth in domestic trade volumes across all three modes, demonstrating the potential for an increasing importance of international trade to the Chicago region's economy.
Chicago region export and import tonnage by mode, 2012 and projected 2040| | Tons (millons) 2012 | Projected Tons (millions) 2040 | Projected Growth |
| Truck | 26 | 71 | 173% |
| Rail | 18 | 45 | 153% |
| Air | 0.6 | 2.1 | 262% |
Discussion
While metropolitan Chicago is the nation's preeminent freight hub, the region faces several challenges to maintaining its competitive advantage in freight. Issues of congestion, outdated infrastructure, complex governance, and inadequate funding must be addressed. GO TO 2040 discusses the region's need to improve the system, and calls for institutional and funding barriers affecting the freight system in northeastern Illinois to be explored. In response to this call, CMAP convened a
Regional Freight Leadership Task Force. The task force discussed the main challenges to the region's freight system and provided recommendations including, establishing a metropolitan freight fund to support the enhancement and modernization of the region's infrastructure, and engaging in robust freight planning. Specifically, the task force recommended the incorporation of comprehensive, multimodal freight planning into the regional comprehensive plan and the immediate initiation of freight planning activities.
In addition to planning for the substantial existing freight traffic, the region will need to adapt to changes in the freight industry. For example, a standardized container size has spurred the rise of intermodal shipments, where freight is transported seamlessly using multiple modes of transportation. While the FAF data does not capture intermodal moves, the next Policy Update in this series will address the rising trend of intermodalism in the Chicago region's freight cluster.