Sales, income, and property tax revenues are the primary source of general funding for state and local government. Governments typically have more discretion over these revenues in comparison to federal grants, user fees, or other funds that must be used for a specific program or purpose. Thus, fluctuations in these revenue sources can affect the ability of state and local governments to budget for public services.
The individual and corporate income taxes, along with the state sales tax, make up about 80 percent of state tax collections and over half of overall state-source revenues. In addition, the State of Illinois shares a proportion of income and sales tax revenues with local governments. The property tax is the largest component of local government revenues, making up about half of all local government revenues in the aggregate. This Policy Update examines the relative stability of these sources over the last twenty years.
Generally speaking, state income and sales taxes exhibit more volatility than property tax revenues. Local units of government can maintain stability in property tax revenues by adjusting rates, while income and sales tax revenues, with set rates, vary based on fluctuations in the volume of taxable income and sales generated. Changes in income and sales tax revenues are the result of a variety of factors. One major factor is the state's economy, which affects the income of Illinois residents, corporate profits, and consumer and business purchases. When economic output goes down, individual income, corporate income, and sales all decline as well. This results in less tax revenue for governments that rely on income and sales taxes.
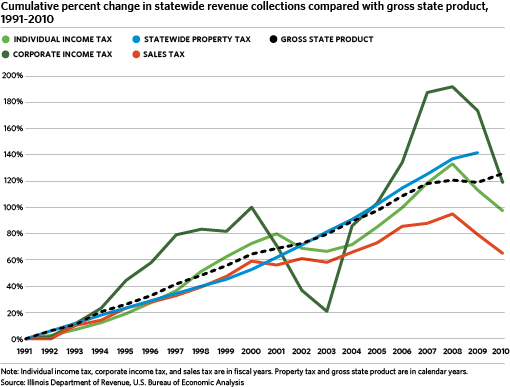
For the purposes of this analysis, gross state product (GSP) is used as a marker of the state economy. The U.S. Bureau of Economic Analysis defines GSP as "the value added in production by the labor and capital located in a state." The following graph illustrates the cumulative percent change for the individual income tax, the corporate income tax, the state sales tax, and statewide property tax extensions as compared with the cumulative percent change in GSP since 1991. Statewide property tax data are unavailable for 2010.
State Sales Tax
While GSP has been less volatile than tax revenues over the twenty-year period, individual income tax, corporate income tax, and state sales tax revenues have generally followed trends in the economy. However, growth in state sales tax revenue has been slower than growth in GSP between 1991 and 2010, and the differential in growth has accelerated over this 20-year period. Between 1991 and 2000, GSP had grown 64.5 percent, while sales tax revenues had grown 59.1 percent. Over the next 10 years, sales tax revenues grew 65 percent between 1991 and 2010, which is significantly lower than the 125.9 percent growth in GSP over the same period.
This differential may partially be a result of the fact that sales tax revenues do not reflect the volume of purchases made from all sectors of the economy in Illinois. Instead, sales tax revenues are based on the volume of sales of products in the sales tax base. Illinois' sales tax base is relatively narrow, primarily comprising of goods and few services. Nationally, consumer expenditures on services grew more than expenditures on goods between 1991 and 2010 -- 178.9 percent and 160 percent, respectively.
State Income Taxes
The individual income tax also followed GSP trends -- frequently exhibiting slower growth or declines during years that GSP shows slower growth. However, individual income tax revenues have mostly exhibited lower cumulative growth than GSP in recent years. This is in part due to the greater volatility of the individual income tax in comparison to GSP. While the growth in the individual income tax has exceeded growth in GSP in a number of years, several declines in individual income tax and the GSP's steady growth have resulted in 97.4 percent growth in the individual income tax over the past twenty years. The increase in GSP in the same period was 125.9 percent.
Corporate income tax revenues generally followed changes in the GSP but were more volatile than GSP and the other tax revenues. Corporate income tax revenues are based on corporate net income (revenues minus costs), thus following economic cycles. Illinois' corporate income tax revenues are more volatile than GSP, because while the GSP is the value of economic output, revenues from the corporate income tax represent only the value accruing as profits to businesses. In addition, during economic downturns and expansions, corporate net income tends to be less stable than the other tax bases. In the first 10 years of the period analyzed, corporate income tax revenue had doubled. However, ups and downs in the business cycle over the next 10 years resulted in both large declines and increases in revenues. At the same time, GSP growth also followed the business cycle, but did not experience declines and increases to the degree that corporate net income did. By 2010, corporate income tax revenues had grown 118.9 percent since 1991 while growth in GSP during the same period was 125.9 percent.
Property Taxes
Meanwhile, property tax extensions rose steadily every year, increasing 141.7 percent between 1991 and 2009. Unlike GSP, property tax revenues did not always follow the economic cycle and did not experience a drop during the recent economic recession. This is because changes in property values do not necessarily accompany changes in personal and corporate income or economic output. In addition, unlike other taxes, property tax bills are not sensitive to taxpayers' incomes and local governments can adjust property tax rates to maintain a stable stream of revenues even if property values decline during an economic cycle.
Implications for Fiscal Stability of Public Finances
Because the State's primary sources of revenue -- taxes on income and sales-- are not particularly stable and are not growing at the same rate at the overall economy, the State may have difficulty deriving revenues from its economic base in the future. Local governments also receive income and sales tax revenue in the form of revenue sharing disbursements from the State, and therefore are affected by the stability of these revenues. However, local governments are less affected by this volatility because they derive much of their revenues from more stable property taxes, a source not utilized by the State.
While the State's tax policies may not be able to alter the national economic cycles that cause some of the volatility in tax revenues, steps can be taken to ensure that growth in tax revenues follows the overall growth of the State's economic output. Broadening the tax base to include a broader scope of the economy would improve revenue stability and help revenues increase according to growth in the economy. Ways to broaden the tax base include expansion of the sales tax base to include additional services or of the individual income tax base to include retirement income. GO TO 2040 recommended convening a Regional Tax Policy Task Force to report to the CMAP board on tax policy issues, including broadening the sales and income tax bases. The Task Force recommended that the CMAP Board support policies that broaden both the sales and income tax bases. See the Task Force web page for more information about its activities.