Read detailed analysis in our Policy Updates blog:
2010 Census Analysis
Nov 4, 2013
2010 Census Analysis
Analysis of 2010 Summary File
Data from 2010 Summary File
For complete details of the latest U.S. census, please visit the Census 2010 website. Below are selected tables and other details about our region compiled by the CMAP staff.
2010 Demographic Profiles
Data below are provided for the City of Chicago, for Suburban Cook County, for the counties of Cook, DuPage, Kane, Kendall, Lake, McHenry and Will and seven-county total. Cook County is still the population leader in the region accounting for 64 percent of total households, 59 percent of family households, and 72 percent of non-family households in the region. You can also download a helpful glossary of terms.
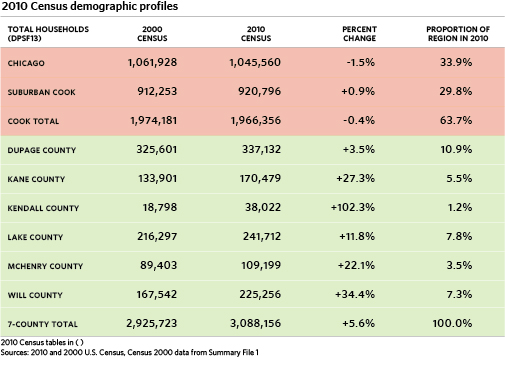
Total Households, Family Households, Non-Family Households, Average Household Size and Family Household Size
The total number of Households, Family Households and Non-Family Households follow historical rankings of population in the region. In descending order they are Cook, DuPage, Lake, Will, Kane, McHenry and Kendall. Even though Kendall County ranks low in total population in 2010, it shows by far the largest percentage gains since Census 2000 for total households, (102 percent), Family Households (101 percent), and Non-Family Households (108 percent). Also as expected, the City of Chicago, Suburban Cook County and Cook County (total) show either very small percentage gains or negative values for total households, family households and non-family households. Suburban counties, (Kendall, Will and Kane) show the largest percentage gain for total households and family households. This seems to confirm the trend of growth away from Cook County that has been the central node of population. Kendall, Will and Kane also show the largest percentage gain for average household size and family household size.
Download a spreadsheet analysis by CMAP of Total Households, Family Households, Non-Family Households, Average Household Size, and Average Family Size for the seven-county region.
Total Occupied Housing Units, Owner-Occupied Housing Units, Renter-Occupied Housing Units
Growth or decline of housing units can also reveal patterns of change. Three areas showed either decline or barely positive growth in Total Occupied Housing units over the decade. These areas are City of Chicago (-1.5 percent), Cook County Total (-0.4 percent), and Suburban Cook (0.9 percent). Growth in the remaining counties and for the seven-county region ranged from 3.5 percent (DuPage) to 102.3 percent (Kendall). The shift in housing patterns away from the regional core (Cook County) continued over the decade. The highest percent gains in number of owner-occupied housing units were Kendall County (105 percent), Will County (34.5 percent) and Kane County (28.3 percent). Changes in Renter-Occupied housing units showed similar patterns with the City of Chicago declining (-3.5 percent), Cook County declining (-1.1 percent), and Suburban Cook increasing by only 5.1 percent. The top three percentage increases were Kendall County (83 percent), Will County (34 percent), and Kane County (24 percent).
Homeowner Vacancy Rate, Rental Vacancy Rate
Both homeowner vacancy and rental vacancy rates grew between year 2000 and year 2010. The range of homeowner vacancy in year 2000 was 0.8 – 1.7 percent. The range in year 2010 was 1.9 – 4.0 percent. Rental vacancy rates ranged from 4.0 – 7.0 percent in year 2000 compared with a range of 7.4-10.1 percent in year 2010.
The City of Chicago and Kendall County ranked within the top 3 highest homeowner vacancy rates in year 2000 (Chicago at 1.7 percent, Kendall County at 1.5 percent) and in year 2010 (Chicago at 4.0 percent and Kendall County at 2.9 percent). On the other hand, Lake and McHenry counties were within the three lowest homeownership vacancy rates during year 2000 (Lake at 1.9 percent, McHenry at 2.0 percent) and during year 2010 (McHenry at 2.0 percent and Lake at 2.3 percent).
No common themes could be found for rental vacancy rates during the two time periods. The highest rental vacancy rates in year 2000 were Will County (7.0 percent), Kendall County (6.0 percent), and Chicago (5.7 percent). During year 2010 the highest rates were Chicago, (10.1 percent), Cook County total (9.6 percent), and Kane County (8.7 percent). The lowest rental vacancy rates in year 2000 were McHenry County (4.0 percent), DuPage County (4.8 percent), and Lake County (5.0 percent). In year 2010 the lowest rental vacancy rates were Will County (7.4 percent), Kendall County, (7.7 percent), followed by DuPage County (7.9 percent).
Download a spreadsheet analysis of Total Occupied Housing Units, Owner-Occupied Housing Units, Renter-Occupied Housing Units, Homeowner Vacancy Rate, and Rental Vacancy Rates for the seven-county region.
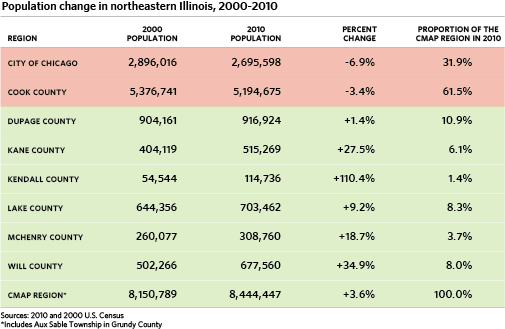
Population Change
Census 2010 and Census 2000 data for places (a designation which includes both cities and villages) within the region are now available. The most current 2010 Census population and housing unit data for the 7 counties in our region together with Census 2000 and 1990 Census data are available here. The table also shows the amount of change between successive decades. Census population totals for all municipalities in the region for each decade from 1950 through 2010 are also provided. Read a more detailed breakdown of the 2010 Census redistricting data for Illinois at CMAP's Policy Updates blog.
In addition to these CMAP products, the Regional Indicators Project relies on data provided by the Census Bureau on population, demographics, housing and some economic indicators. CMAP and The Chicago Community Trust released MetroPulse, a comprehensive data visualization website, on November 17, 2010. Visit MetroPulse to create and view tables, charts and maps based on Census data products. CMAP has allocated resources to ensure that 2005-2009 American Community Survey and 2010 Decennial Census data are updated on MetroPulse as soon as possible.
Additional analysis of the 2010 Census data will be provided as it becomes available over the coming year. For more information on the U.S. Census, including interactive maps, which are embeddable on your own website, please see our main Census page.
If you would like to make an information request, please fill out this form.
How can census data can help you
...develop an economic profile of your community. Community leaders, company owners, workforce boards, and school districts can get a general economic overview to understand how the community fares with adjacent neighbors and with other communities in your county and metro region with census data. Some overview components include:
- Growth or decline in population
- Population by race and ethnicity
- Age by educational attainment
- Earnings by education
- Industry by occupation
- Poverty status
...get grants. The decennial census is required by the U.S. Constitution to apportion seats in the House of Representatives among the states. Census data is also used to distribute federal funds such as Medicaid, and grants for highway planning and construction, transit, state and local education, individuals with disabilities education, temporary aid for needy families, children's health insurance, and community development. Getting the most accurate census count will result in your community getting more federal dollars.
Nov 4, 2013
2010 Census Analysis
Analysis of 2010 Summary File
Data from 2010 Summary File
For complete details of the latest U.S. census, please visit the Census 2010 website. Below are selected tables and other details about our region compiled by the CMAP staff.
2010 Demographic Profiles
Data below are provided for the City of Chicago, for Suburban Cook County, for the counties of Cook, DuPage, Kane, Kendall, Lake, McHenry and Will and seven-county total. Cook County is still the population leader in the region accounting for 64 percent of total households, 59 percent of family households, and 72 percent of non-family households in the region. You can also download a helpful glossary of terms.
Total Households, Family Households, Non-Family Households, Average Household Size and Family Household Size
The total number of Households, Family Households and Non-Family Households follow historical rankings of population in the region. In descending order they are Cook, DuPage, Lake, Will, Kane, McHenry and Kendall. Even though Kendall County ranks low in total population in 2010, it shows by far the largest percentage gains since Census 2000 for total households, (102 percent), Family Households (101 percent), and Non-Family Households (108 percent). Also as expected, the City of Chicago, Suburban Cook County and Cook County (total) show either very small percentage gains or negative values for total households, family households and non-family households. Suburban counties, (Kendall, Will and Kane) show the largest percentage gain for total households and family households. This seems to confirm the trend of growth away from Cook County that has been the central node of population. Kendall, Will and Kane also show the largest percentage gain for average household size and family household size.
Download a spreadsheet analysis by CMAP of Total Households, Family Households, Non-Family Households, Average Household Size, and Average Family Size for the seven-county region.
Total Occupied Housing Units, Owner-Occupied Housing Units, Renter-Occupied Housing Units
Growth or decline of housing units can also reveal patterns of change. Three areas showed either decline or barely positive growth in Total Occupied Housing units over the decade. These areas are City of Chicago (-1.5 percent), Cook County Total (-0.4 percent), and Suburban Cook (0.9 percent). Growth in the remaining counties and for the seven-county region ranged from 3.5 percent (DuPage) to 102.3 percent (Kendall). The shift in housing patterns away from the regional core (Cook County) continued over the decade. The highest percent gains in number of owner-occupied housing units were Kendall County (105 percent), Will County (34.5 percent) and Kane County (28.3 percent). Changes in Renter-Occupied housing units showed similar patterns with the City of Chicago declining (-3.5 percent), Cook County declining (-1.1 percent), and Suburban Cook increasing by only 5.1 percent. The top three percentage increases were Kendall County (83 percent), Will County (34 percent), and Kane County (24 percent).
Homeowner Vacancy Rate, Rental Vacancy Rate
Both homeowner vacancy and rental vacancy rates grew between year 2000 and year 2010. The range of homeowner vacancy in year 2000 was 0.8 – 1.7 percent. The range in year 2010 was 1.9 – 4.0 percent. Rental vacancy rates ranged from 4.0 – 7.0 percent in year 2000 compared with a range of 7.4-10.1 percent in year 2010.
The City of Chicago and Kendall County ranked within the top 3 highest homeowner vacancy rates in year 2000 (Chicago at 1.7 percent, Kendall County at 1.5 percent) and in year 2010 (Chicago at 4.0 percent and Kendall County at 2.9 percent). On the other hand, Lake and McHenry counties were within the three lowest homeownership vacancy rates during year 2000 (Lake at 1.9 percent, McHenry at 2.0 percent) and during year 2010 (McHenry at 2.0 percent and Lake at 2.3 percent).
No common themes could be found for rental vacancy rates during the two time periods. The highest rental vacancy rates in year 2000 were Will County (7.0 percent), Kendall County (6.0 percent), and Chicago (5.7 percent). During year 2010 the highest rates were Chicago, (10.1 percent), Cook County total (9.6 percent), and Kane County (8.7 percent). The lowest rental vacancy rates in year 2000 were McHenry County (4.0 percent), DuPage County (4.8 percent), and Lake County (5.0 percent). In year 2010 the lowest rental vacancy rates were Will County (7.4 percent), Kendall County, (7.7 percent), followed by DuPage County (7.9 percent).
Download a spreadsheet analysis of Total Occupied Housing Units, Owner-Occupied Housing Units, Renter-Occupied Housing Units, Homeowner Vacancy Rate, and Rental Vacancy Rates for the seven-county region.
Population Change
Census 2010 and Census 2000 data for places (a designation which includes both cities and villages) within the region are now available. The most current 2010 Census population and housing unit data for the 7 counties in our region together with Census 2000 and 1990 Census data are available here. The table also shows the amount of change between successive decades. Census population totals for all municipalities in the region for each decade from 1950 through 2010 are also provided. Read a more detailed breakdown of the 2010 Census redistricting data for Illinois at CMAP's Policy Updates blog.
In addition to these CMAP products, the Regional Indicators Project relies on data provided by the Census Bureau on population, demographics, housing and some economic indicators. CMAP and The Chicago Community Trust released MetroPulse, a comprehensive data visualization website, on November 17, 2010. Visit MetroPulse to create and view tables, charts and maps based on Census data products. CMAP has allocated resources to ensure that 2005-2009 American Community Survey and 2010 Decennial Census data are updated on MetroPulse as soon as possible.
Additional analysis of the 2010 Census data will be provided as it becomes available over the coming year. For more information on the U.S. Census, including interactive maps, which are embeddable on your own website, please see our main Census page.
If you would like to make an information request, please fill out this form.
How can census data can help you
...develop an economic profile of your community. Community leaders, company owners, workforce boards, and school districts can get a general economic overview to understand how the community fares with adjacent neighbors and with other communities in your county and metro region with census data. Some overview components include:
- Growth or decline in population
- Population by race and ethnicity
- Age by educational attainment
- Earnings by education
- Industry by occupation
- Poverty status
...get grants. The decennial census is required by the U.S. Constitution to apportion seats in the House of Representatives among the states. Census data is also used to distribute federal funds such as Medicaid, and grants for highway planning and construction, transit, state and local education, individuals with disabilities education, temporary aid for needy families, children's health insurance, and community development. Getting the most accurate census count will result in your community getting more federal dollars.