History
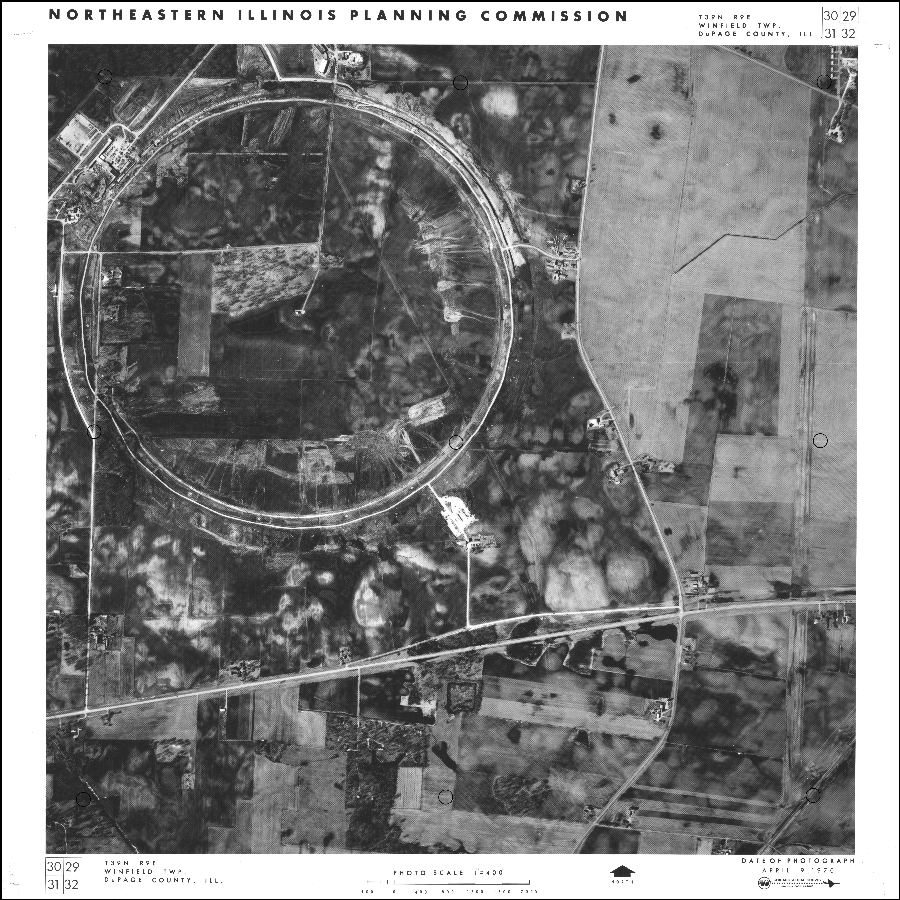
The Northeastern Illinois Planning Commission contracted for aerial photography every five years beginning in 1970 to monitor the distribution and change of land use in the region. The mylar enlargements were available for inspection at NIPC offices, and Diazo "blackline" reproductions could be purchased. As the Diazo printing process gave way to high-speed digital scanning, the quality of the reproductions suffered. While there is still a great deal of interest in the images, there was no longer a way to provide a cost-effective means of reproduction that yielded a useable print.
This scanning effort, then, serves two purposes: first, to create a digital archive of a unique historical resource; and second, to make the scans freely available for download through a publicly-accessible interface. While not without flaws, these scans represent the best available solution for extending the utility of the photographs.
Scanning Process
Scanning took place at CMAP's offices, using a Vidar HD3630 wide-format scanner. While the scanner has the capability of 600 DPI resolution, testing at CMAP determined that the optimal resolution was between 250 and 300 DPI; since the images on the mylars are not continuous-tone, scanning at a higher resolution yielded no improvement in quality. Descreening was used to help minimize the moiré effects. After repeated tests, these settings were also established:
- Image type: Grayscale (8 bit)
- Levels:
- Contrast: 0
- Brightness: 0
- Gamma: 2.0
- White point: 255
- Black point: 0
- Sharpen/Smoothen:
- Intensity: 0
- Radius: 1.0
- Threshold: 0
- Smoothen: 0
The scanning process was tracked using an Access database, with a separate table for each year and each table containing one record for each potential scan ("potential" because some images have been lost or damaged over the years). The records were pre-populated with as much meta-data as possible (township/range/section numbers, political township, contractor name); during scanning, the technician added additional information such as the date of the photograph, and verified the township name.
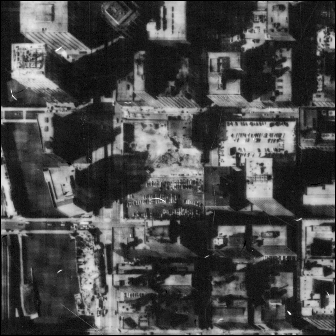
A Note About the 1970 Set: Many of the mylar sheets that were scanned to create the 1970 images had been subjected to considerable wear over the decades that they were in active use. This wear resulted in many of the original scanned images being very dark, some to the point of being nearly unusable; frequently there were also noticeable differences in darkness between photos of adjacent areas. To increase the amount of detail visible in the photos – as well as to improve their general aesthetic – a pair of "droplets" were created in Adobe Photoshop. These allowed pre-defined sets of adjustments to be applied to large batches of images simultaneously. One droplet was used on the darkest 25% of the 1970 images, which significantly boosted their contrast and brightness; the other, which modified the images to a much smaller extent, was applied to the remaining 75% of photos. The result is a set of images that is much more legible and more consistent, photo-to-photo.
Georeferencing
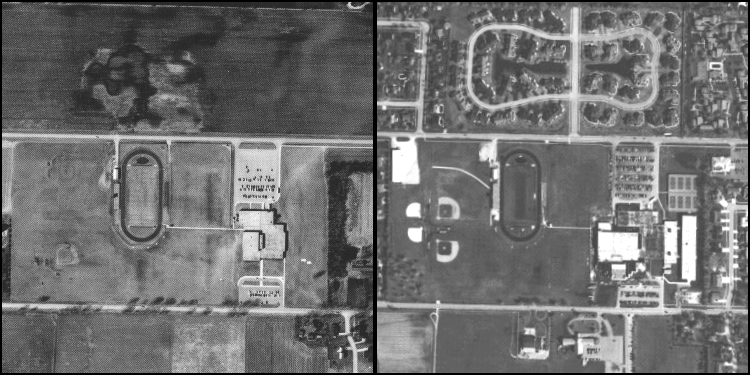
Each scanned image was georeferenced with Esri's ArcMap software package. The primary data source used to assign control points to the scanned images was orthorectified aerial imagery from 2005. Supplemental data sources included orthoimagery from 2010 (with higher resolution than the 2005 imagery), Public Land Survey System boundaries, and major road centerlines from 2005. Wherever possible, the corners of short buildings that had certainly not changed in the years since being photographed were used as control points.
A minimum of six control points were created for each image, although 12-15 were desirable. These points were distributed around the image as evenly as possible in an attempt to minimize distortion. With very few exceptions, only 1st order polynomial (affine) transformations were used to georeference the images; while higher-order polynomial transformations are good for correcting distortions, these images (being scanned from mylar sheets that don't warp with age) are unlikely to contain significant distortions, and the transformations would likely introduce distortion into areas of the image without many control points.