MetroPulse Main Navigation with Logo
metropulse - Health and Safety
Health and Safety
Total number of homicides in the City of Chicago
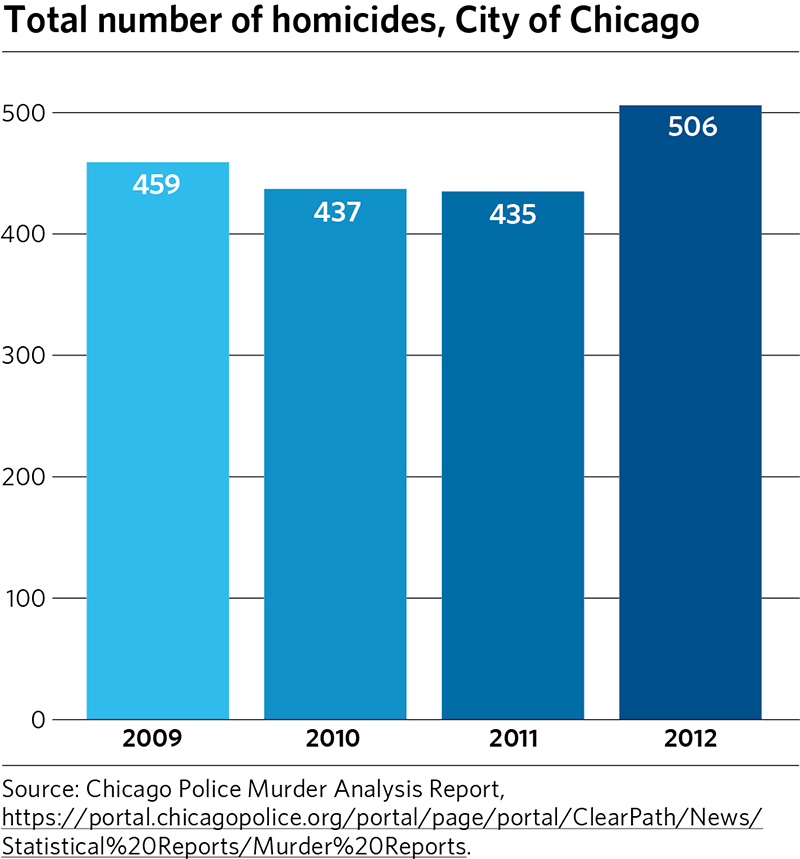
One of the most difficult issues for Chicago has been its persistently high homicide levels. In the early 1990s, homicides were consistently from 800 to 900 per year. Consistent with a long downward trend nationally, Chicago levels have also fallen. Over the past several years murders have been in the low 400s with an increase to slightly over 500 in 2012.
| YEAR | 2009 | 2010 | 2011 | 2012 |
| TOTAL | 459 | 437 | 435 | 506 |
Index crime for the City of Chicago
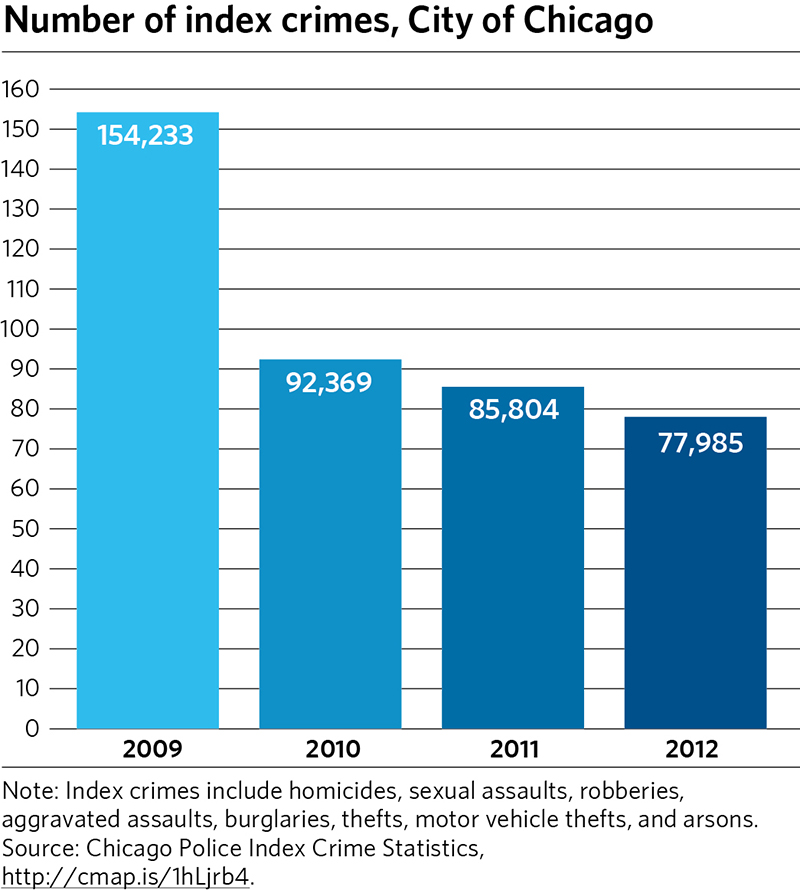
One of the most important attributes of a livable city is its level of crime. Crime rates influence how people feel about the safety of their families and personal and business property. Types of crime in the index include violent crime such as assault and property crime such as theft.
| YEAR | 2009 | 2010 | 2011 | 2012 |
| TOTAL | 154,233 | 92,369 | 85,504 | 77,985 |
Daily Servings of Vegetables for Adults in the City ofChicago (2007-2009)
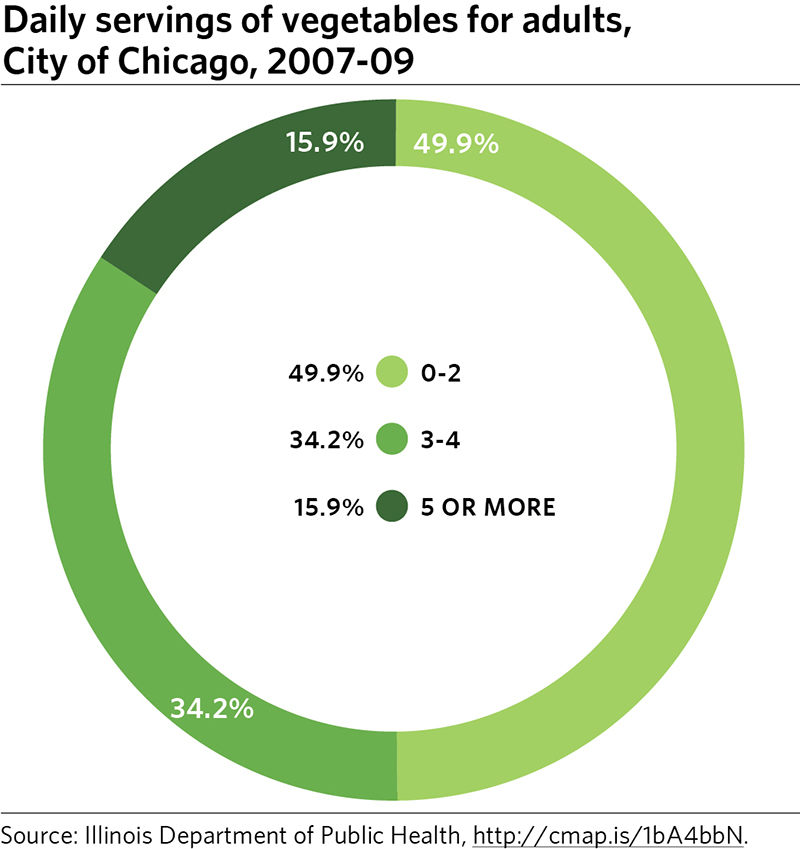
The consumption of vegetables lowers the risk of developing chronic diseases and can help individuals maintain a healthy weight (State Indicator Report on Fruits and Vegetables 2013, Center for Disease Control).
| NUMBER OF SERVINGS PER DAY | 0-2 | 3-4 | 5 or more |
| PERCENTAGE | 49.9% | 34.2% | 15.9% |
Percentage of Chicago's Adult Population Reporting that they have been Diagnosed with Diabetes (City of Chicago)
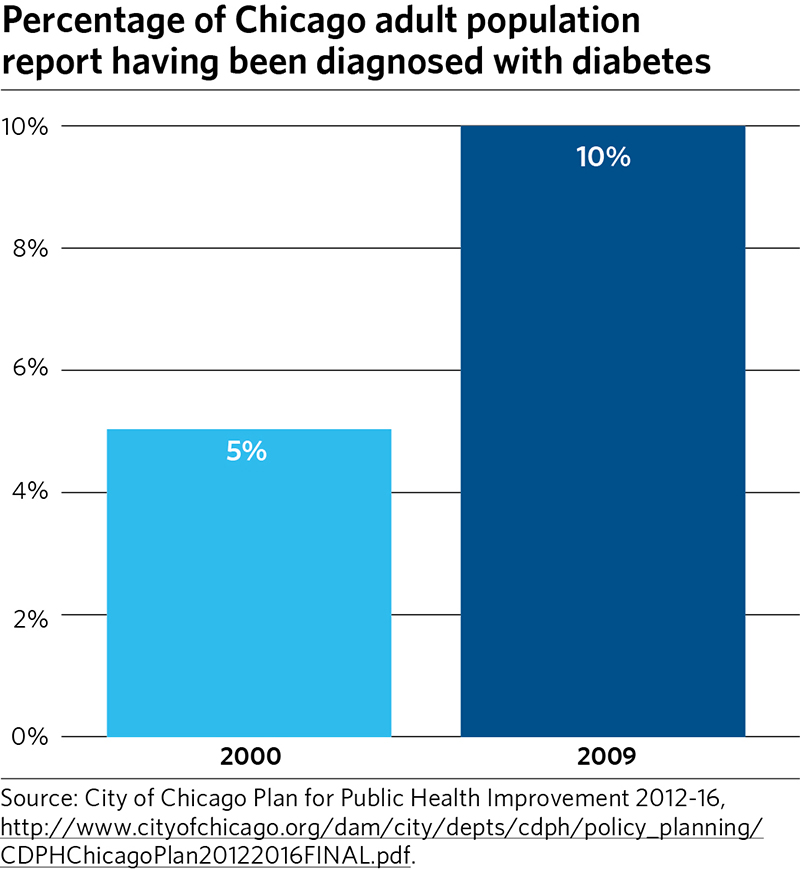
Diabetes can lead to serious complications and premature death. With proper diagnosis and treatment, it is possible to lower the risks associated with the disease. In Chicago, Diabetes is the fifth leading cause of death.
| YEAR | 2000 | 2009 | |
| PERCENT OF ADULTS | 5% | 10% |
SOURCE: City of Chicago Plan for Public Health Improvement 2012-2016
Percent of Insured and Uninsured Individuals in the City of Chicago (2012)
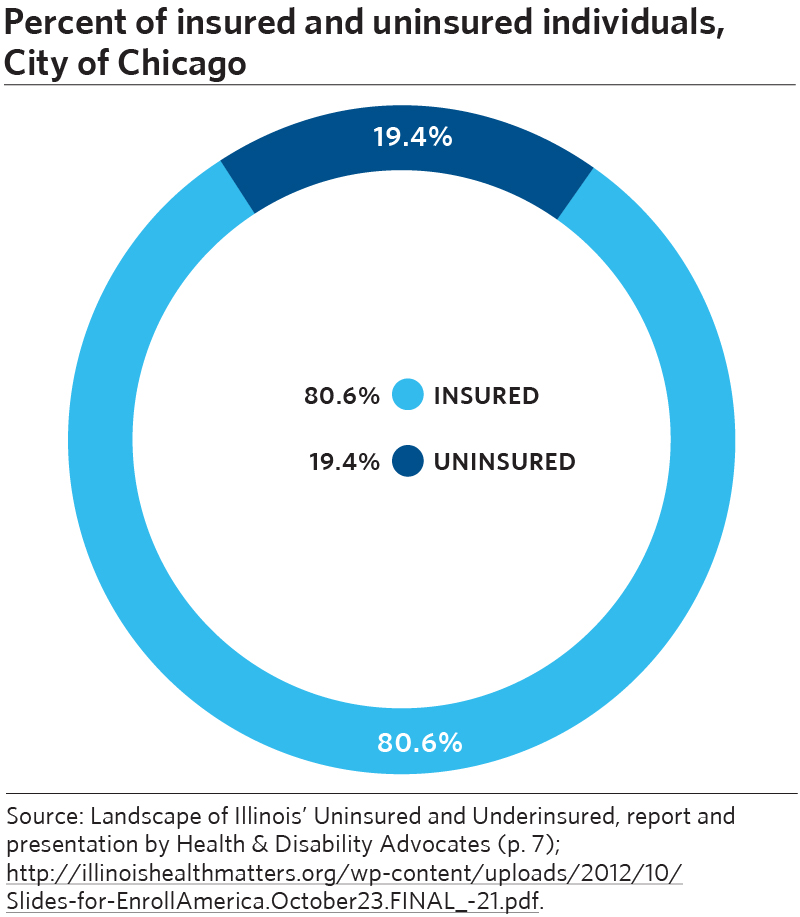
Providing insurance to all Americans has been a challenge, the Affordable Care Act, passed in its current state, seeks to deliver health care coverage for all.
Uninsured in Chicago: 533,702 (19.4% of the population)
Insured in Chicago: 2,181,298 (80.6% of the population)
Adults
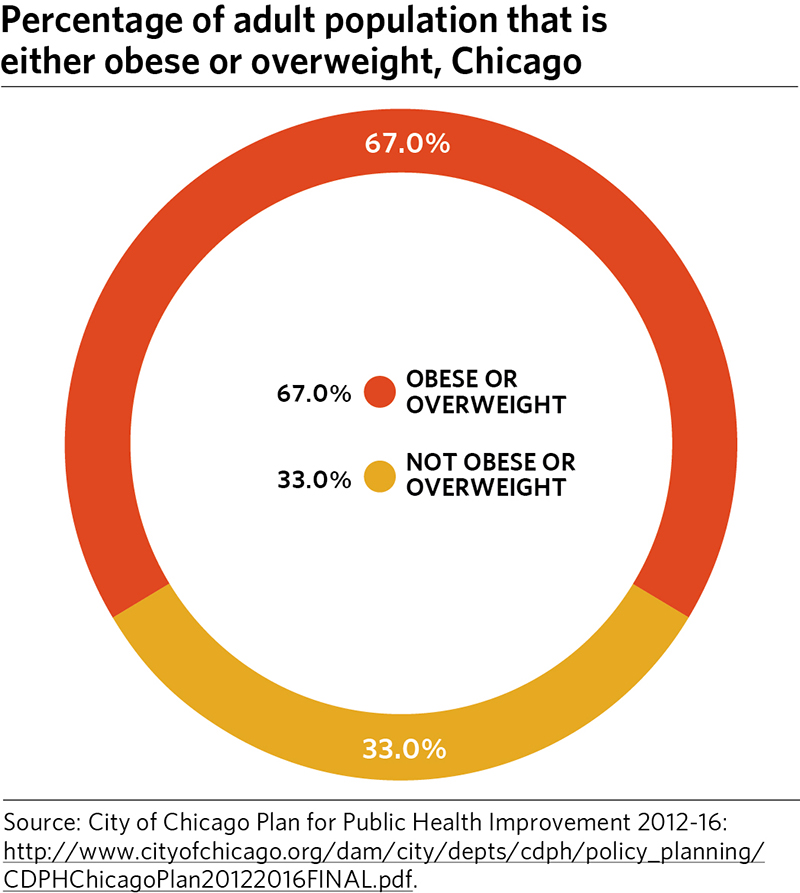
The percentage of overweight Chicagoans has remained steady at 37%, for a total of 67% of the population who were either obese or overweight in 2009. Obesity increases the risk of diseases, such as heart disease, diabetes, and some forms of cancer.
SOURCE: City of Chicago Plan for Public Health Improvement 2012-2016
Children
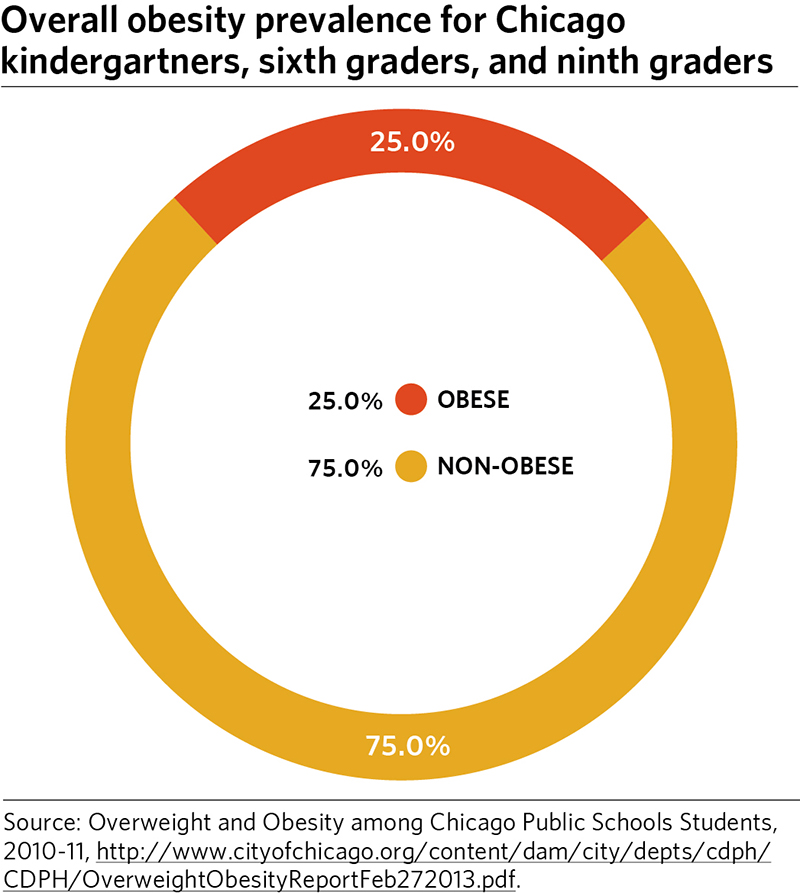
Chicago Department on Public Health report on CPS students: obesity prevalence was higher in sixth graders (29%) and ninth graders (25%) than in kindergartners (20%). The overall prevalence of obesity for the three grades was 25%. Excess weight, especially obesity, has a negative impact on almost every impact on an individual's health.
SOURCE: Overweight and Obesity among Chicago Public Schools Students, 2010-11, City of Chicago
metropulse - Workforce, Economic Development, and Education
Workforce, Economic Development, and Education
Poverty Rate for the Six County Area
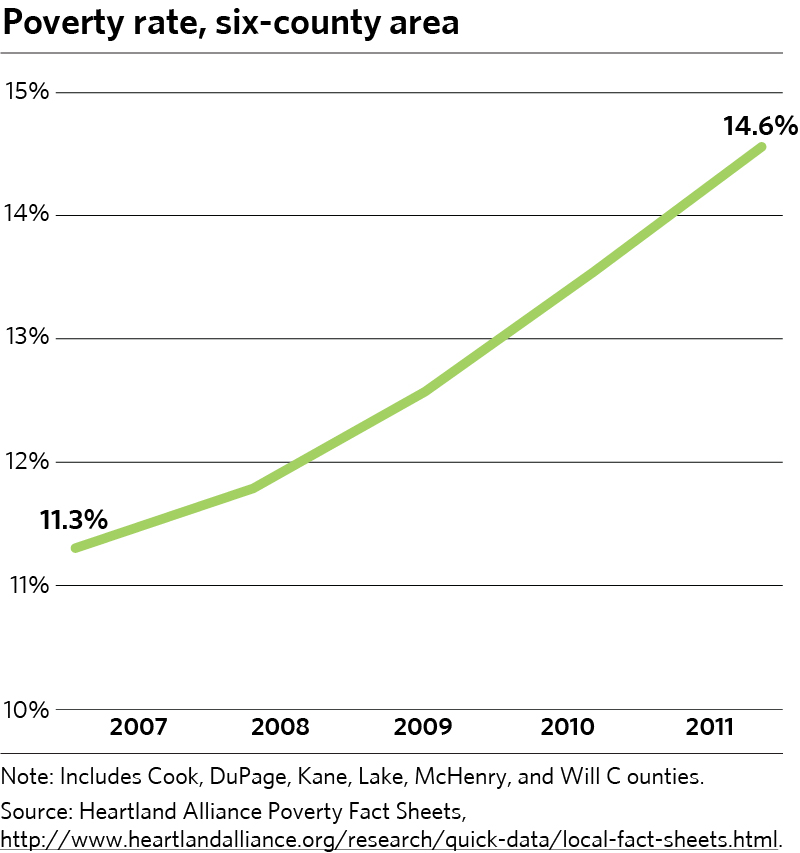
The federal poverty threshold in 2013 for a four-person family unit with two children was $23,550. People whose incomes fall below the federal poverty level face extreme difficulty satisfying their basic human needs for food, clothing and housing. (Source: US Census & American Community Survey).
| YEAR | 2007 | 2008 | 2009 | 2011 |
| RATE | 11.3% | 11.8% | 12.6% | 14.6% |
NOTE: Includes Cook, DuPage, Kane, Lake, McHenry, and Will Counties
SOURCE: Heartland Alliance Poverty Fact Sheets
Unemployment Rate: Chicago MSA
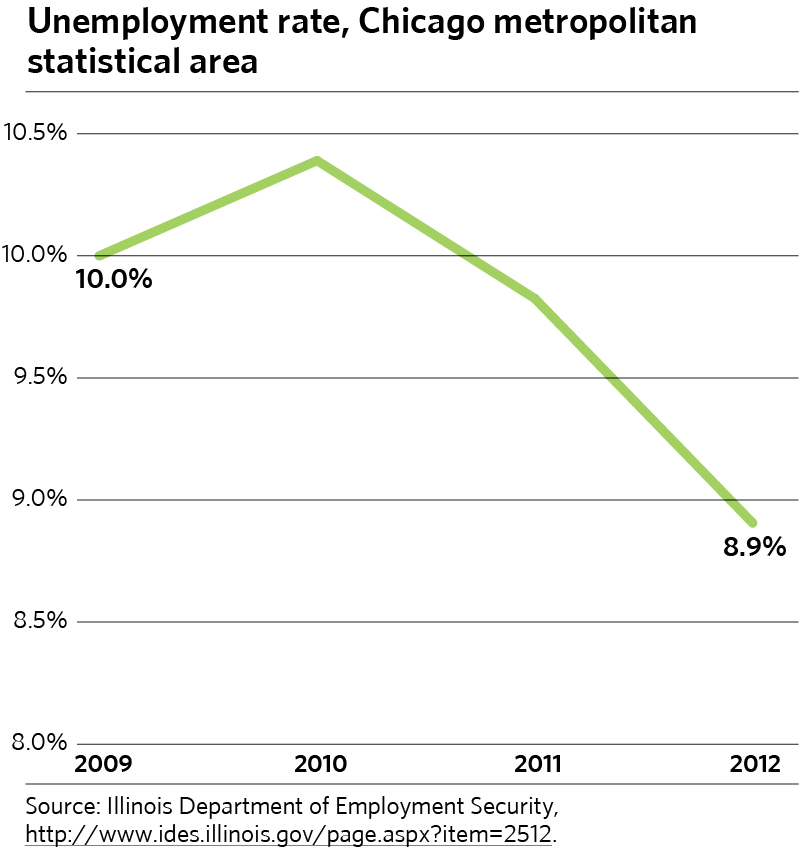
Employment and Unemployment rates track the portion of the workforce age 16+ that are employed or unemployed, looking for and available to work. Unemployment negatively impacts regional quality of life by making it difficult for families to purchase the goods and services they need, such as housing, food and education. (Source: Illinois Department of Employment Security)
| YEAR | 2009 | 2010 | 2011 | 2012 |
| RATE | 10.0% | 10.4% | 9.8% | 8.9% |
Median Family Income: Chicago MSA
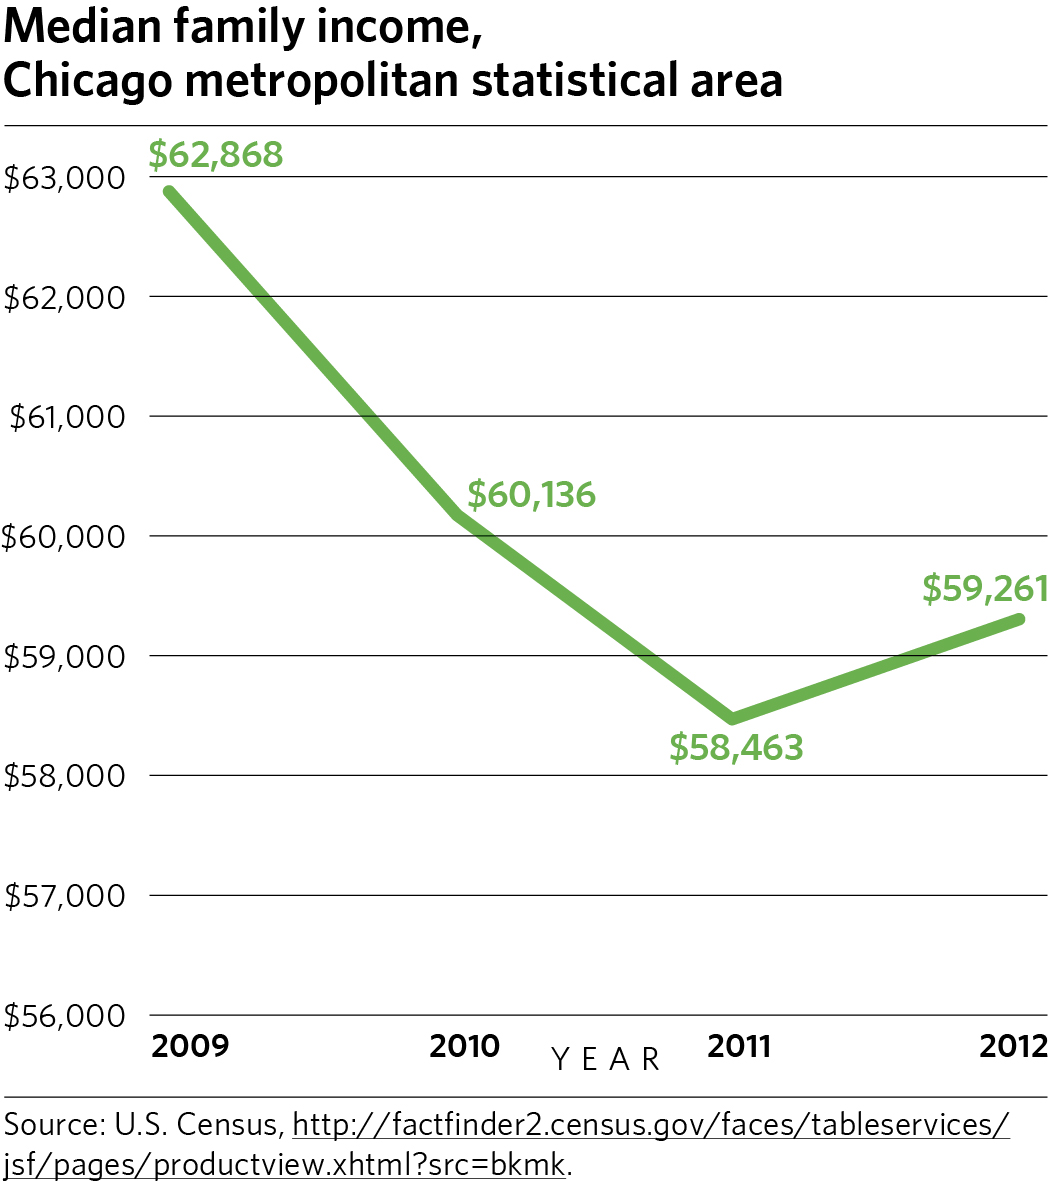
The median household income is the middle value of all household incomes recorded by the US Census or American Community Survey. It is a reflection of economic prosperity. By definition, exactly half of the households within the target geography have more the median income and half are have less. Beyond salary and wage income, this measure includes income derived from rental properties, investments, social security and public assistance. (Source: US Census & American Community Survey)
| YEAR | 2009 | 2010 | 2011 | 2012 |
| MEDIAN INCOME | $76,192 | $72,773 | $70,901 | $72,164 |
SOURCE: US Census
Gross Regional Product: Chicago MSA (in millions)
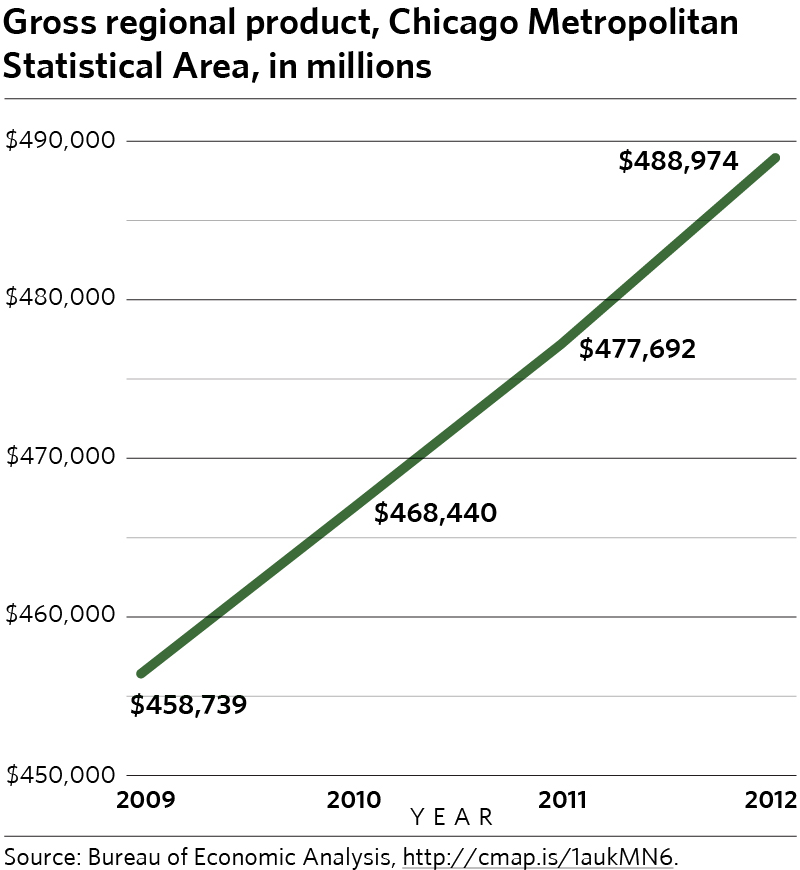
Gross regional product (GRP) is equal to the total dollar value of all the goods and services produced within the region. Compared to other regions, this indicator helps us to understand how competitive we are economically. (Source: Bureau of Economic Analysis)
| YEAR | 2009 | 2010 | 2011 | 2012 |
| PRODUCTIVITY | $458,739 | $468,440 | $477,692 | $488,974 |
SOURCE: Bureau of Economic Analysis
Productivity Per Capita: Chicago MSA
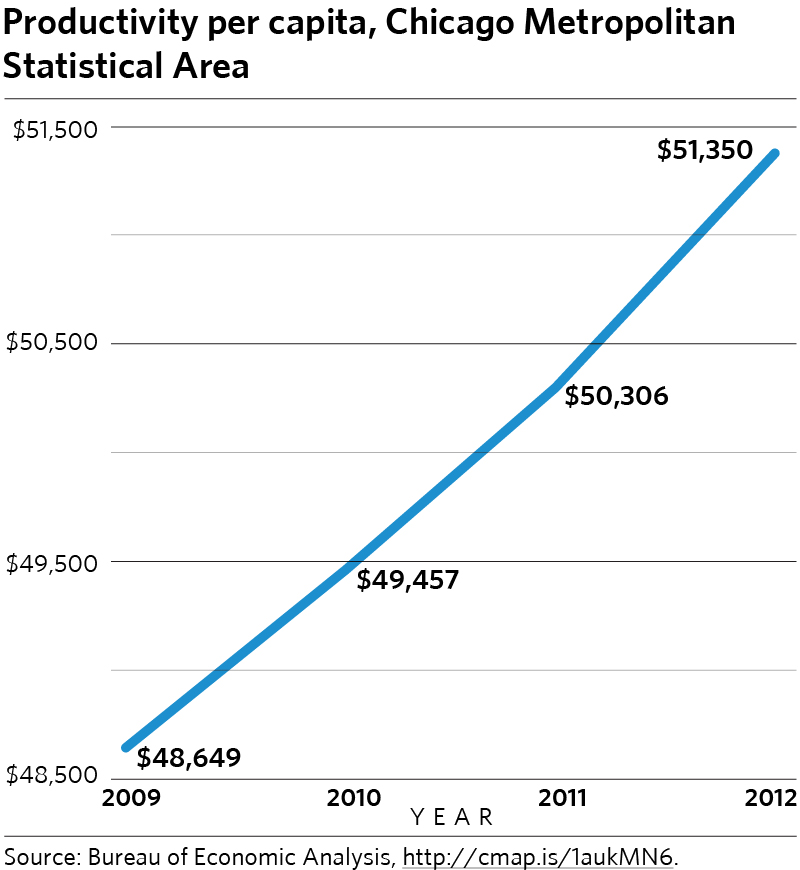
| YEAR | 2009 | 2010 | 2011 | 2012 |
| PRODUCTIVITY | $48,649 | $49,457 | $50,306 | $51,350 |
SOURCE: Bureau of Economic Analysis
Percent of CPS Students Meeting or Exceeding State Standards Overall on ISAT for Grades 3-8

The Illinois Standards Achievement Test (ISAT) assesses students' performance in reading and mathematics in grades three through eight and science in grades four and seven. The state sets cut scores at which students are deemed meeting standards at each grade level on each test. The percent of students meeting or exceeding state standards in grades 3 through 8 across the district represents the percent of students who scored at or above the cut scores in reading, mathematics and science.
The ISAT scores are one measure of students' achievement but do not provide a full picture of what students know or are able to do. However, beginning in 2014-15, the state will give a new cross state assessment, Partnership for Assessment of Readiness for College and Careers (PARCC), to assess students' knowledge and skills as outlined in the Common Core State Standards for English/Language Arts and Mathematics. Science will continue to be assessed with ISAT until a new assessment is developed.
| YEAR | 2009 | 2010 | 2011 | 2012 | 2013 |
| PERCENTAGE OF STUDENTS | 42% | 44.8% | 48.7% | 50.7% | 52.5% |
5- Year CPS Cohort Graduation Rates
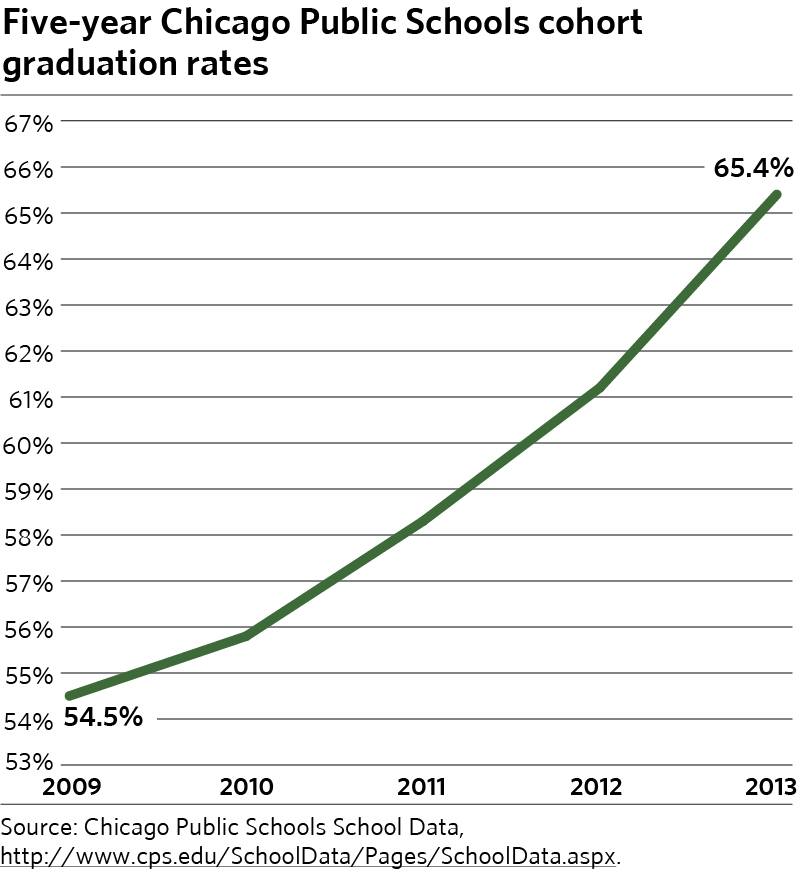
The five-year cohort graduation rate is the percent of first-time freshmen who graduated from high school within five years of starting as freshman. For example, the 2013 rate tracks ninth grade students who were freshmen for the first time in CPS in the 2008-09 school year and graduated from CPS by August 2013. A cohort graduation rate is the best way to determine high school graduation because it systematically follows students over time. Following students for five years provides an opportunity to capture students who may have experienced a delay (failing some courses or being out of school for a short time period) in their schooling.
| YEAR | 2009 | 2010 | 2011 | 2012 | 2013 |
| GRADUATION RATE | 54.5% | 55.8% | 58.3% | 61.2% | 65.4% |
Educational Attainment of Adults over the Age of 25 for the Region
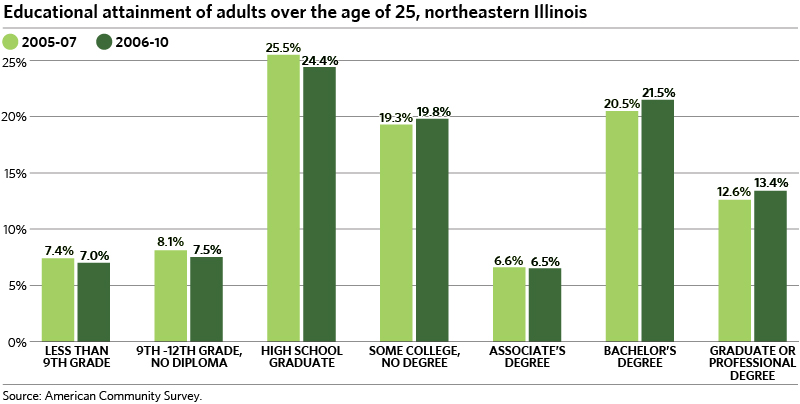
Educational attainment rates provide an understanding of the percentage of adults who have at least earned a specific level of education. Here the focus is on the percent of adults age 25 and older who have at least earned a Bachelor's Degree.
| LEVEL ATTAINED | Less than 9th Grade | 9th-12th Grade, No Diploma | High School Graduate | Some College No Degree | Associate's Degree | Bachelor's Degree | Graduate or Professtional Degree |
| 2005-07 | 7.4% | 8.1% | 25.5% | 19.3% | 6.6% | 20.5% | 12.6% |
| 2006-10 | 7.0% | 7.5% | 24.4% | 19.8% | 6.5% | 21.5% | 13.4% |
SOURCE: American Community Survey
metropulse - Housing and Homelessness
Housing and Homelessness
Properties with Foreclosure Filings: Six County Area
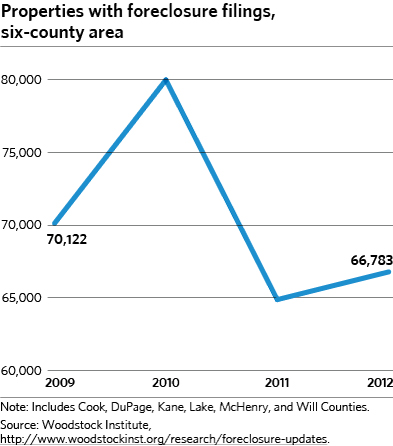
The impacts of foreclosure on communities include declining property values, increased violent crime, displacement of renters, and increased service burdens on municipal governments.
| YEAR | 2009 | 2010 | 2011 | 2012 |
| NUMBER OF PROPERTIES | 70,122 | 79,986 | 64,877 | 66,783 |
NOTE: Includes Cook, DuPage, Kane, Lake, McHenry, and Will Counties
SOURCE: Woodstock Institute
Percentage of Cost Burdened Owners in the City of Chicago
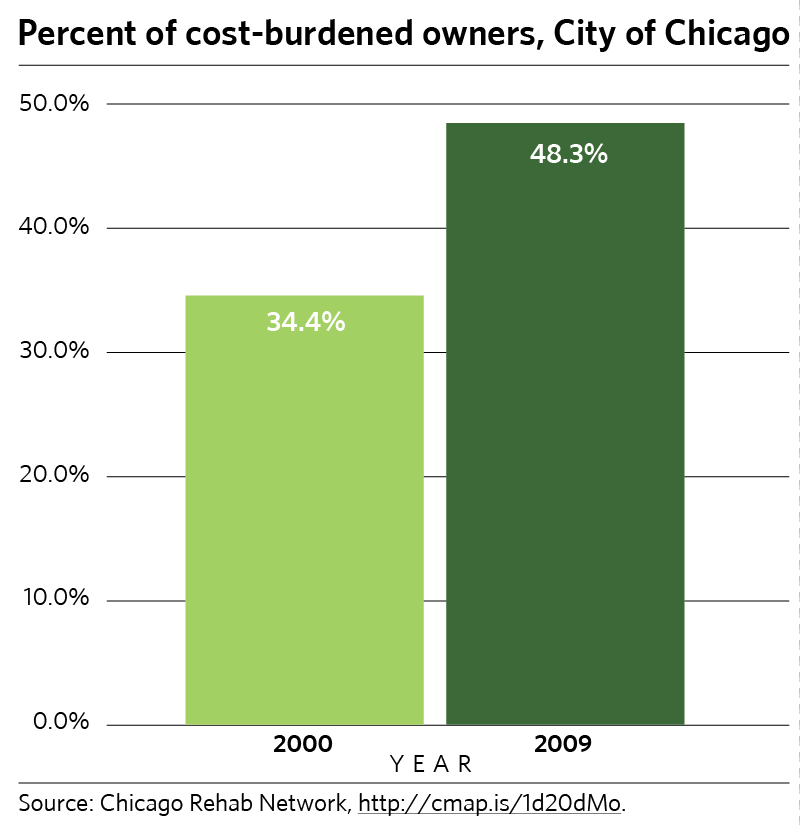
Households paying more than 30% of their income on housing costs may run the risk of not being able to pay for other essentials like food, health care, transportation, child care, transportation and clothing. As the percent of housing cost burdened households increases, the region becomes more sensitive to other economic stresses, such as declining real incomes or increasing unemployment. (Source: US Census & American Community Survey)
| YEAR | 2000 | 2009 |
| PERCENTAGE | 34.4% | 48.3% |
SOURCE: Chicago Rehab Network
Percentage of Cost Burdened Renters in the City of Chicago
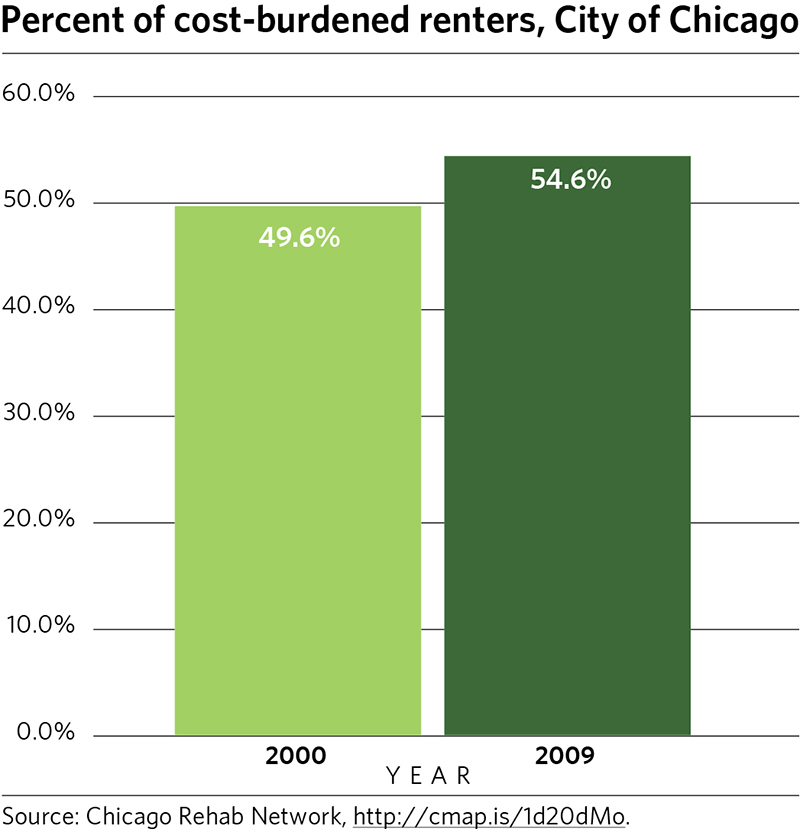
| YEAR | 2000 | 2009 |
| PERCENTAGE | 49.6% | 54.6% |
SOURCE: Chicago Rehab Network
Bi-annual Point in Time Count for the Chicago Continuum of Care
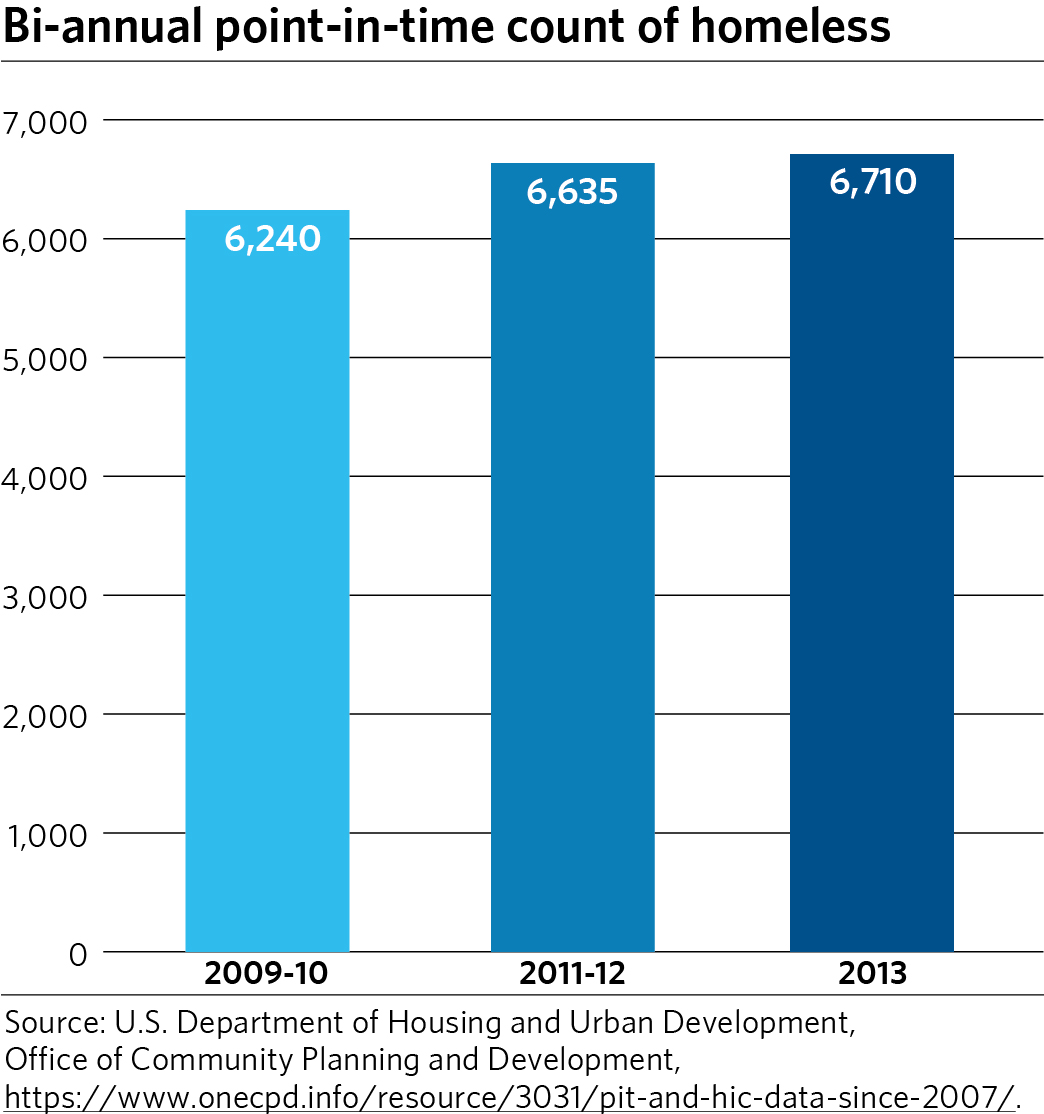
The Point-in-Time Count is a one-day count of sheltered and unsheltered homeless persons. This count is performed one day every 2 years and is based on the US Department of Housing and Urban Development's (HUD) definition of homelessness: ‘when an individual lacks a fixed, regular and adequate place to sleep or who regularly spends the night in an emergency shelter, similar institution, or a place not meant for human habitation."
| YEAR | 2009 | 2010 | 2011 | 2012 |
| POINT IN TIME COUNT | 6,240 | 6,240 | 6,635 | 6,710 |
SOURCE: US Department of Housing and Urban Development, Office of Community Planning and Development
metropulse - Disabilities
Disabilities
Percentage of Persons with Intellectual and Developmental Disabilities Living in Own or Family Home (State of Illinois)
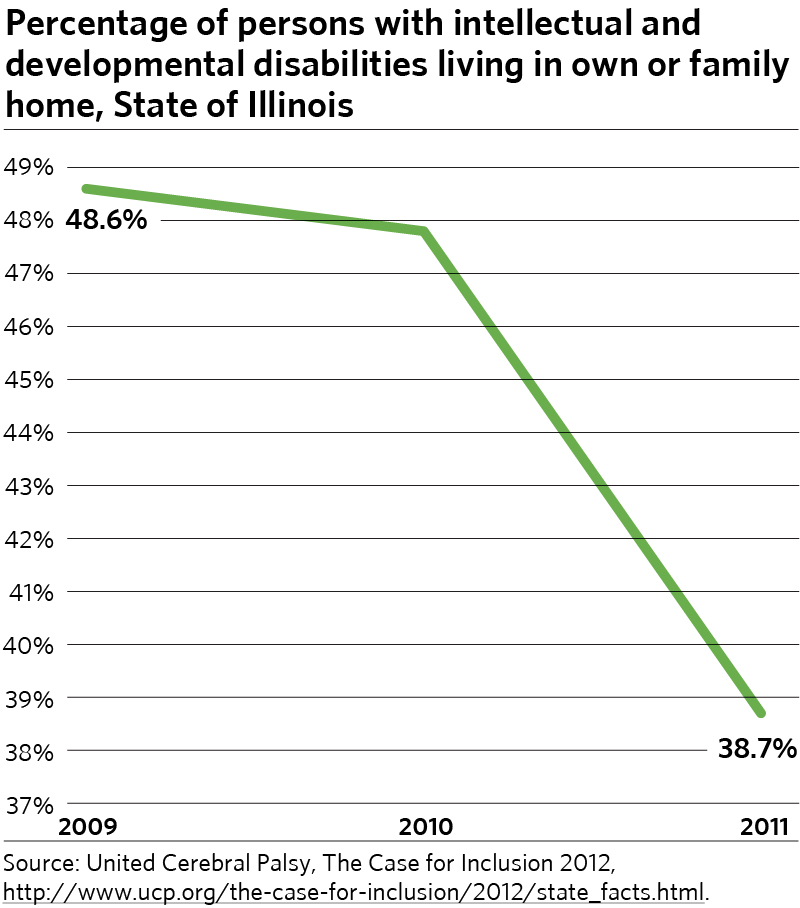
A series of consent decrees settled between the State of Illinois and courts based on the U.S. Supreme Court's decision in 2011 affirmed that disabled persons receiving state funded services are entitled to live in the least restrictive setting possible. Consequently, much work has been done in recent years to interpret the law and implement changes based on these decrees. The percentage of disabled persons living their own home is one measure of how effectively the state is supporting persons in settings outside of large institutions such as nursing homes or mental hospitals.
| YEAR | 2009 | 2010 | 2011 |
| PERCENTAGE | 48.6% | 47.8% | 38.7% |
Median Annual Labor Earnings of Working People with Disabilities in Illinois Compared To the Rest of the Population
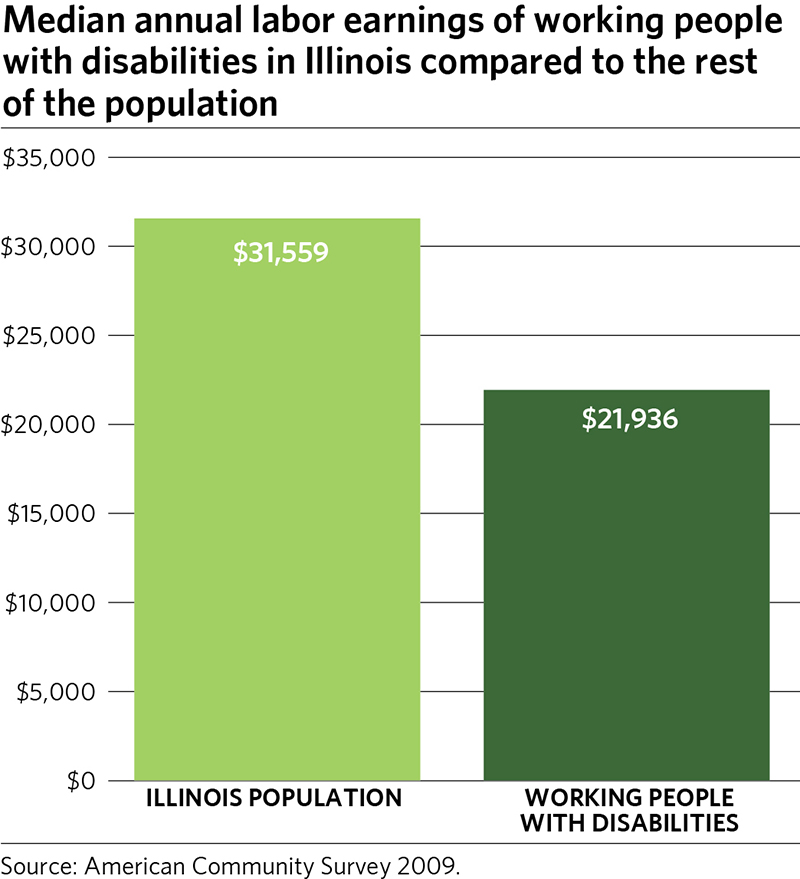
In Illinois the median annual labor earnings of working people with disabilities is nearly $10,000 less than working people without disabilities.
| WORKING PEOPLE WITH DISABILITIES | $21,396 |
| POPULATION | $31,559 |
SOURCE: American Community Survey 2009
metropulse - Public Capacity and Equity
Public Capacity and Equity
Charitable Giving (City of Chicago)
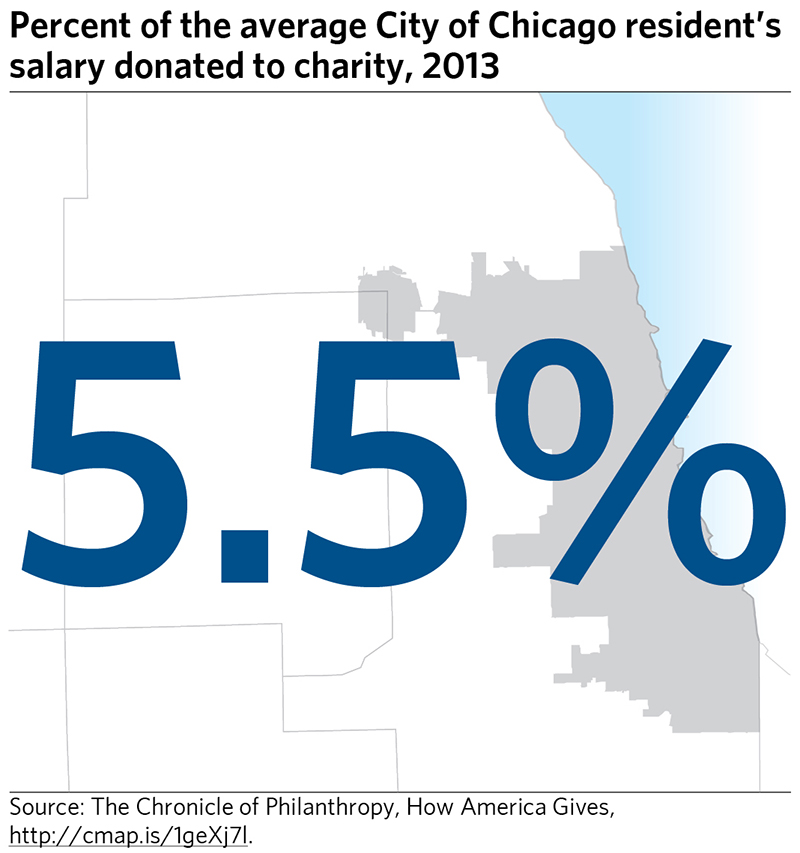
Charitable giving is an indicator of the compassion individuals feel for those in need and the desire to make a contribution to the community. The average Chicagoan gives 5.5% of their annual salary to charity.
Disparity in per Capita School District Operational Expenditures per Pupil (2011)

Operating expenditure per pupil is the gross operating cost of a school district (except summer school, adult education, bond principal retired, and capital expenditures) divided by the nine month average daily attendance for the regular school term (Illinois State Board of Education).
| STATEWIDE | $11,537 |
| CPS | $13,078 |
SOURCE: Illinois Interactive Report Card, Northern Illinois University
Sum of Unpaid State Bills
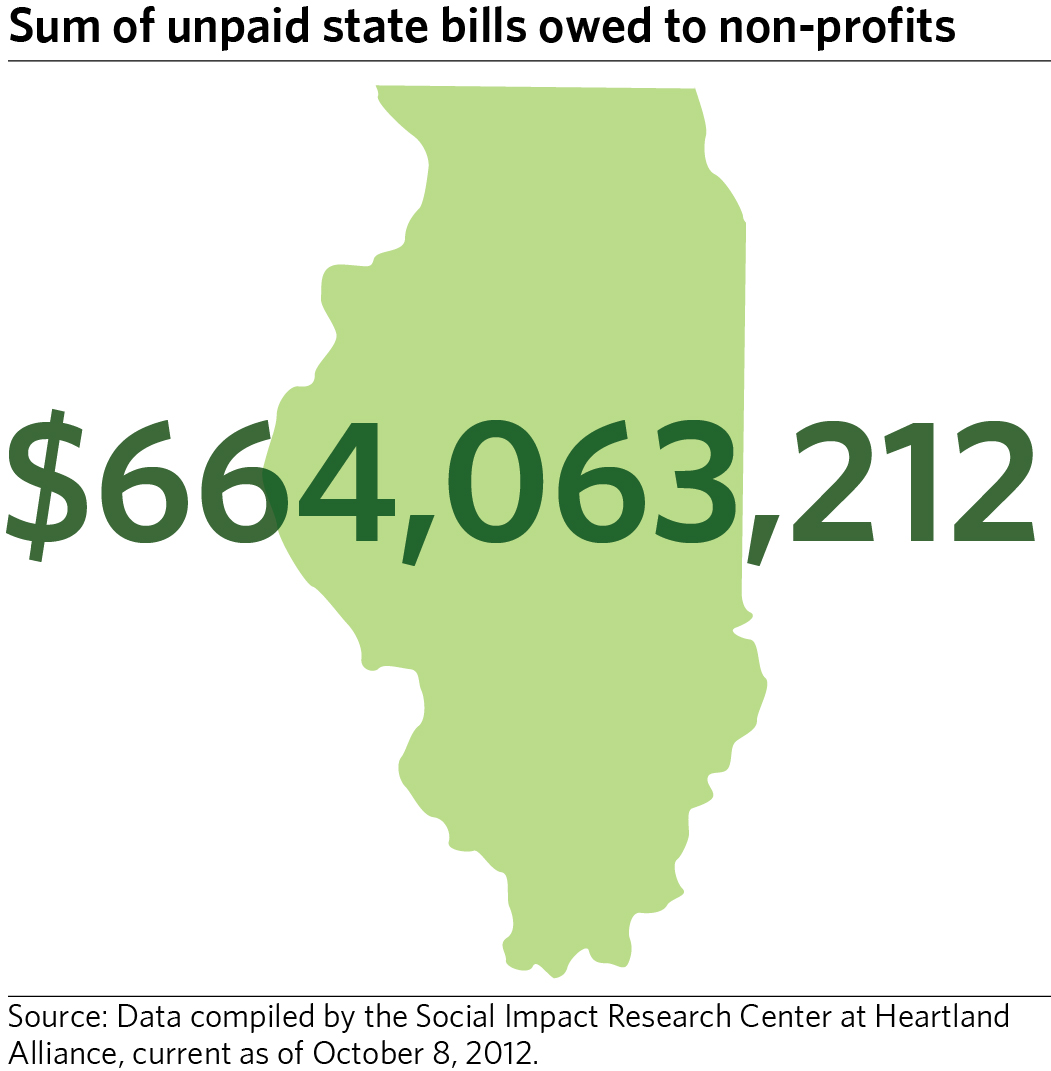
As of October 8, 2012 the sum of state bills 61-180 days past due for nonprofit organizations is $664,063,212. Many nonprofit organizations operate on a lean budget and have found themselves in financial crises as a result of these unpaid bills.
SOURCE TO CITE: from data compiled by the Social Impact Research Center at Heartland Alliance and is current as of October 8, 2012
Illinois Firm Sizes by Industry
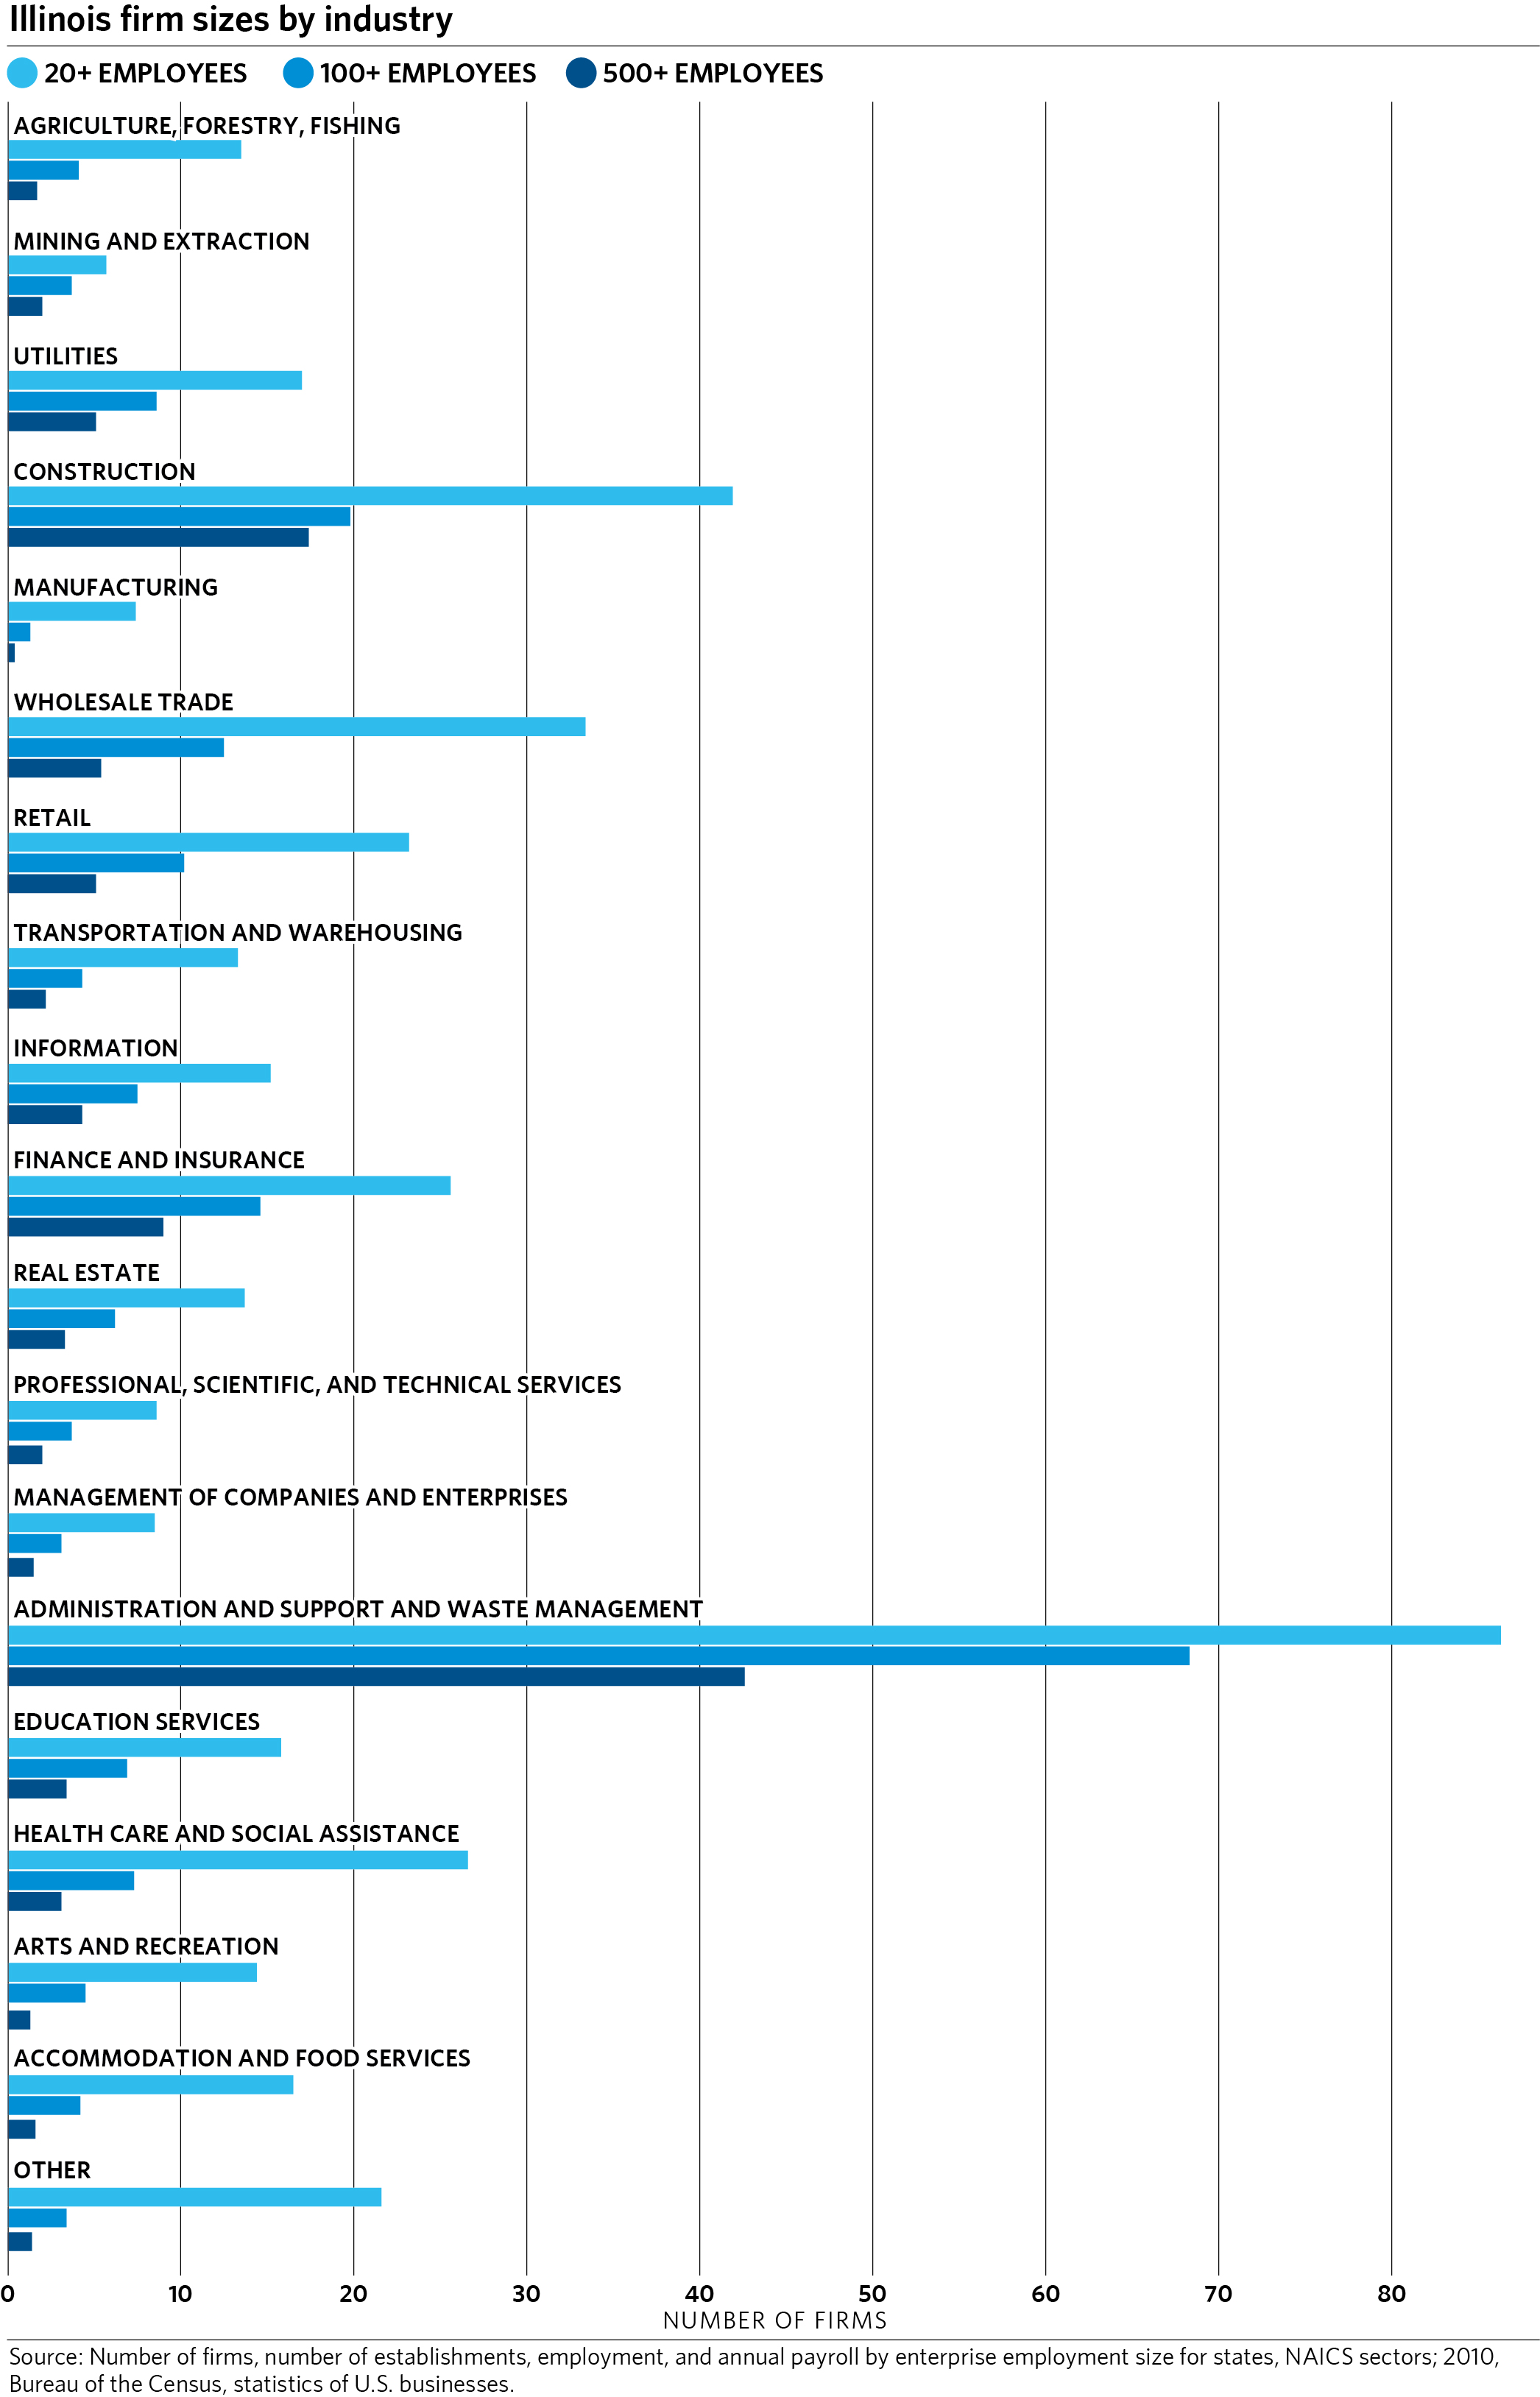
Persons concerned with the quality of human services in Illinois often argue that the sector is populated by too many small organizations and needs to be consolidated both to improve quality and efficiency. This chart compares the distribution of firm size in human services industry in Illinois with firm sizes in other industries. It shows that the distribution of large and small firms in human services is nearly identical to that of retail and finance and insurance, and is approximately the median size distribution among all industries in Illinois.
| All | 20+ | 100+ | 500+ |
| Ag, forestry, fishing | 13.5 | 4.1 | 1.7 |
| Mining & extraction | 5.7 | 3.7 | 2 |
| Utilities | 17 | 8.6 | 5.1 |
| Construction | 41.9 | 19.8 | 17.4 |
| Manufacturing | 7.4 | 1.3 | 0.4 |
| Wholesale trade | 33.4 | 12.5 | 5.4 |
| Retail | 23.2 | 10.2 | 5.1 |
| Transp & Warehousing | 13.3 | 4.3 | 2.2 |
| Information | 15.2 | 7.5 | 4.3 |
| Finance and Insurance | 25.6 | 14.6 | 9 |
| Real estate | 13.7 | 6.2 | 3.3 |
| Prof, sci, tech svcs | 8.6 | 3.7 | 2 |
| Mgmt of cos | 8.5 | 3.1 | 1.5 |
| Admin & support & waste mgmt | 86.3 | 68.3 | 42.6 |
| Educational svcs | 15.8 | 6.9 | 3.4 |
| Heath care and social assistance | 26.6 | 7.3 | 3.1 |
| Arts & recreation | 14.4 | 4.5 | 1.3 |
| Accommodation and food svcs | 16.5 | 4.2 | 1.6 |
| Other | 21.6 | 3.4 | 1.4 |
SOURCE TO CITE: Number of Firms, Number of Establishments, Employment, and Annual Payroll by Enterprise Employment Size for States, NAICS Sectors: 2010, Bureau of the Census, Statistics of U.S. Businesses
Comparison of Elected Officials to Constituency based on Gender (City of Chicago)
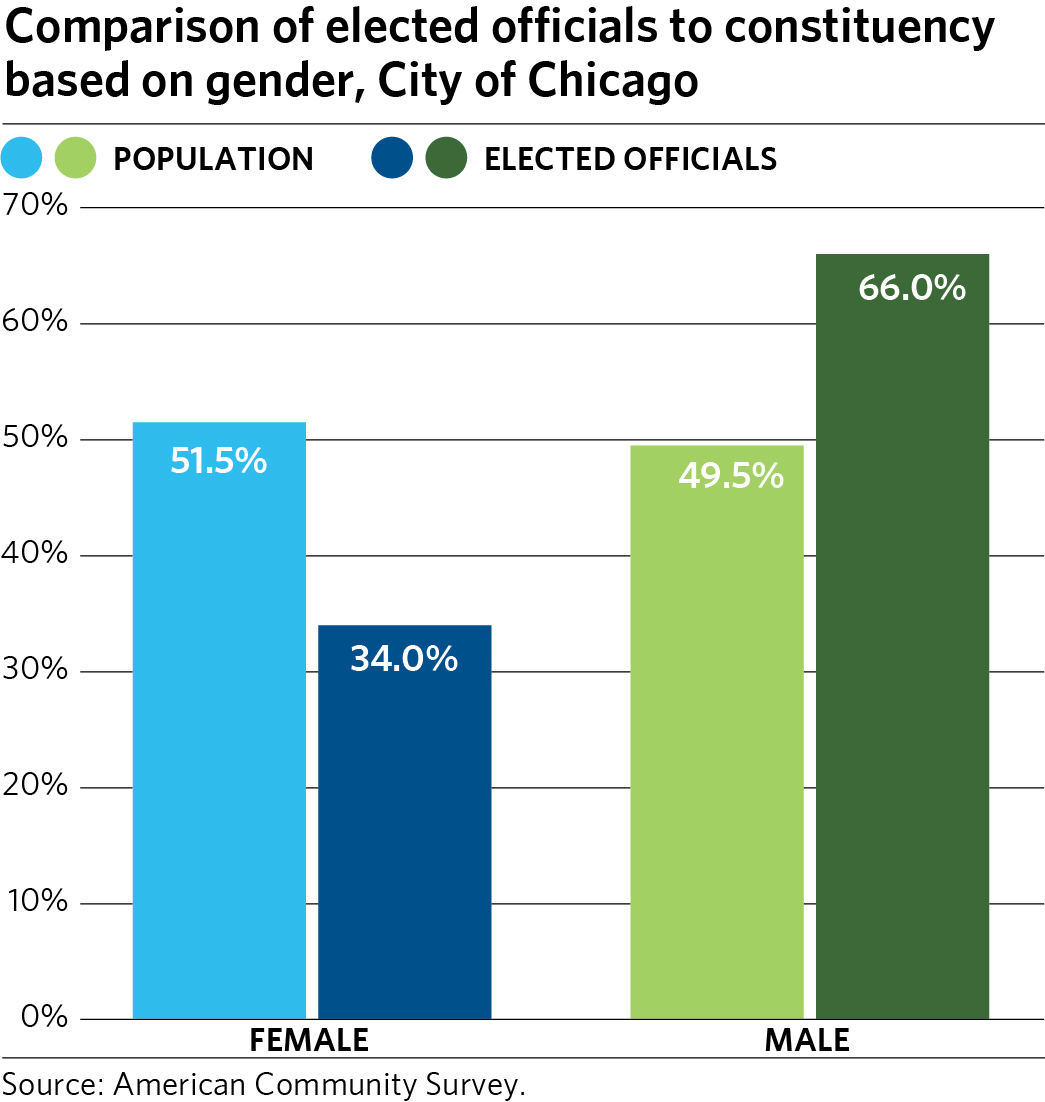
| Gender | Female | Male |
| Population | 51.50% | 49.50% |
| Elected Officials | 34% | 66% |
SOURCE: Population demographics from the ACS
Voter Turnout as a Percentage of Voting Age and Population (City ofChicago)
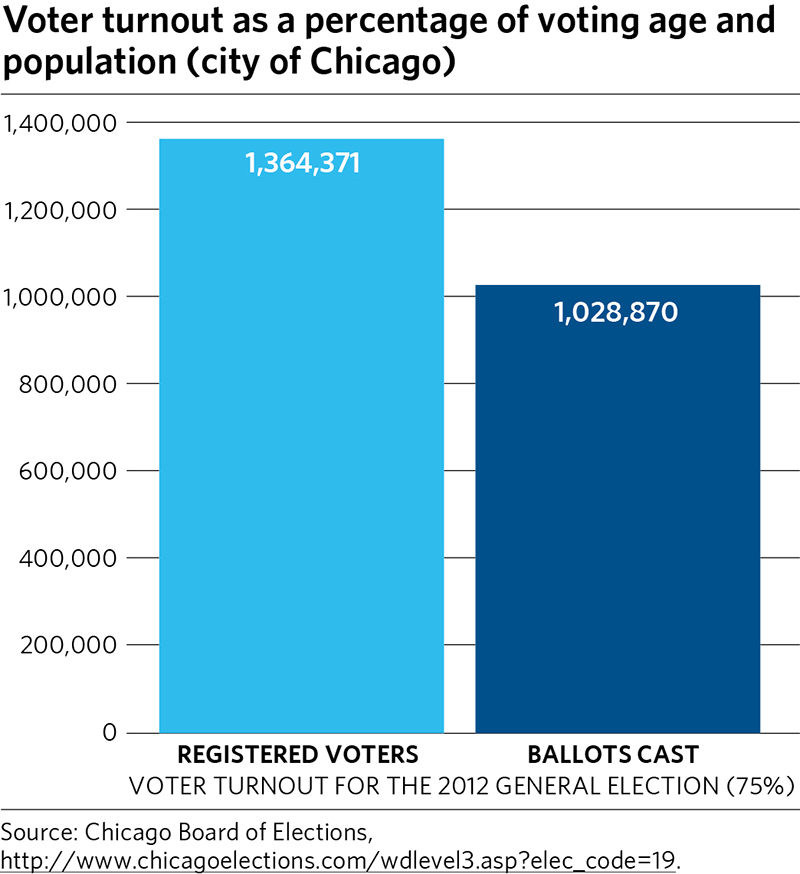
Political participation is one of the most basic forms of civic engagement and voting is the most fundamental form of participation. Both nationally and locally, voting rates have been lower than many would wish and so it is important to monitor progress on this indicator. While this website reports turnout for the general election, mid-term (non-presidential) elections normally have substantially lower voter turnout.
| Ballots Cast | 1,028,870 |
| Registered Voters | 1,364,371 |
SOURCE: Chicago Board of Elections
Early Childhood Care Programs Supply and Demand for the City of Chicago (Preschool for All and Headstart)
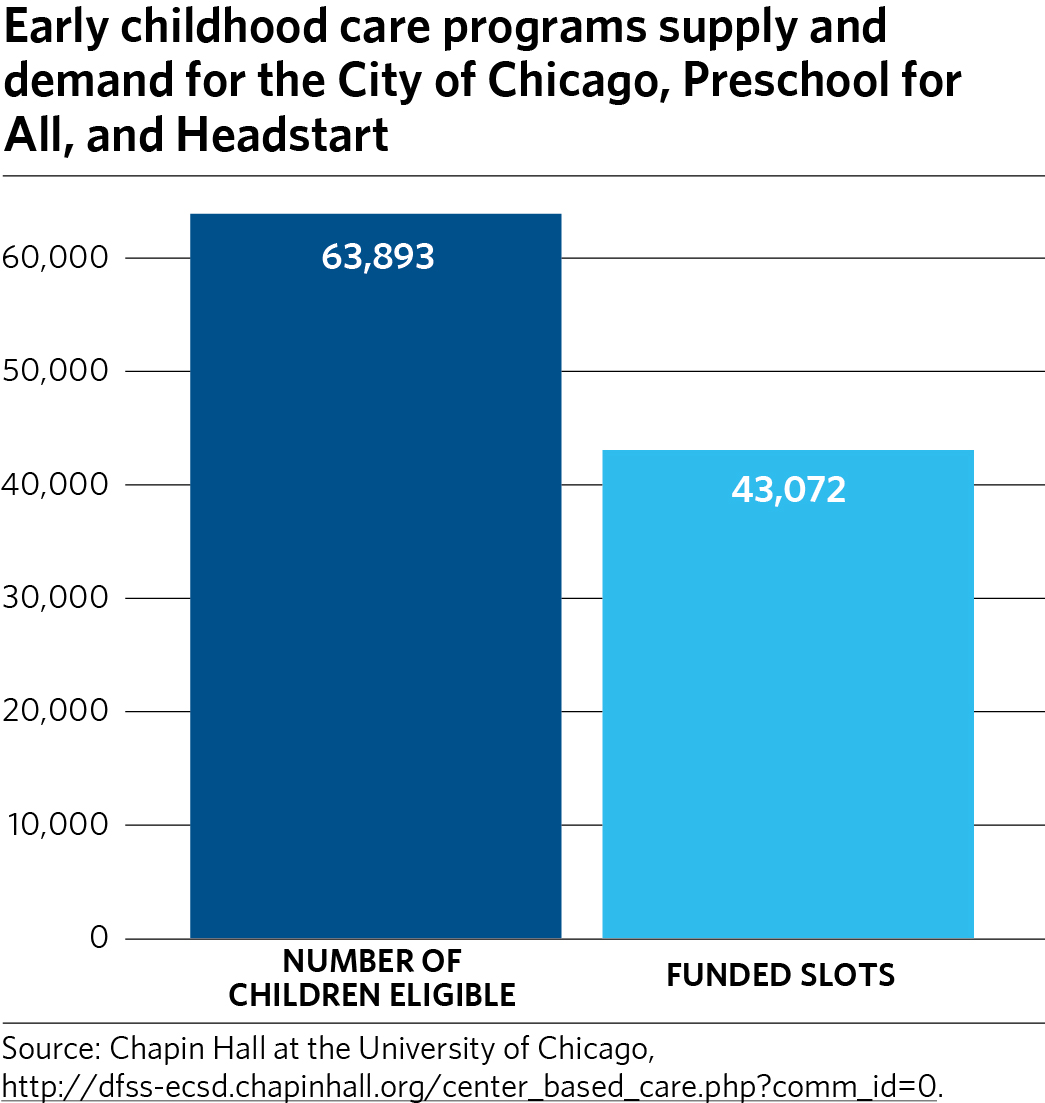
Early childhood programs are a product of City, State of Illinois, and federal financial resources and the availability of childcare seats for lower income persons depends upon those resources. The number of children enrolled in childcare depends upon the availability of programs to families, their cost, quality, and individual preferences for different types of care for children.
| Number of Children Eligible | 63,893 |
| Number of Funded Slots | 43,072 |
Percentage of Persons Linguistically Isolated in the City of Chicago (2012)
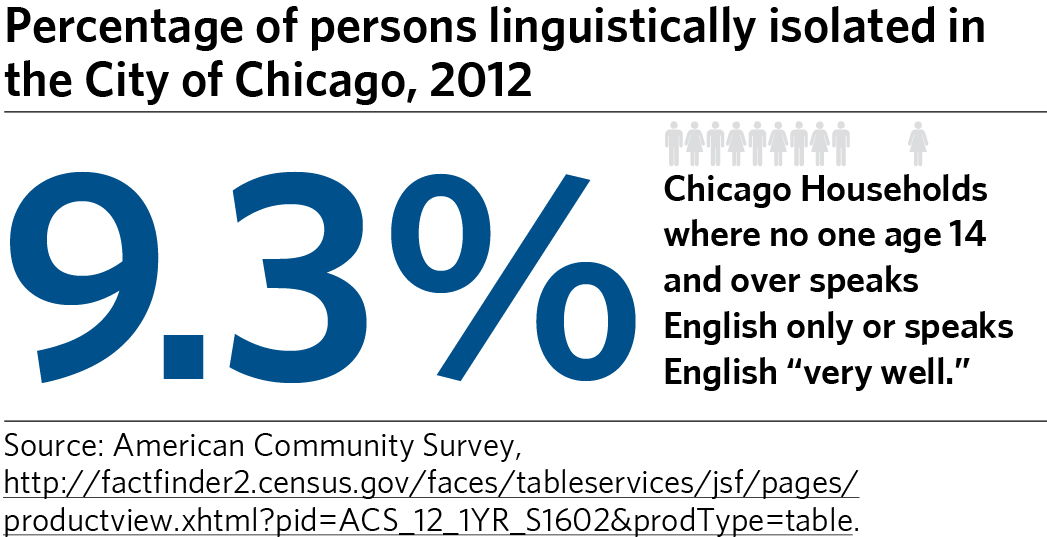
Chicago has since its origins been a city of immigrants who came here speaking an amazing array of languages. While Chicago draws much of its unique cultural flavor from the huge variety of languages and people encountered across the city, it is also important that residents speak English. Command of English is important for employment, for kids doing well in school, and for generally being able to access all that the City has to offer. It is, therefore, important to monitor the proportion of Chicagoans who do not speak English at all, or as well as they would like, and to assure that persons who would like to speak English better are afforded opportunities to learn.
| Chicago Households where no one age 14 and over speaks English only or speaks English "very well" | 9.3% |
SOURCE: American Community Survey
metropulse - Art
Art
Number of people working in Arts, Recreation and Entertainment by county
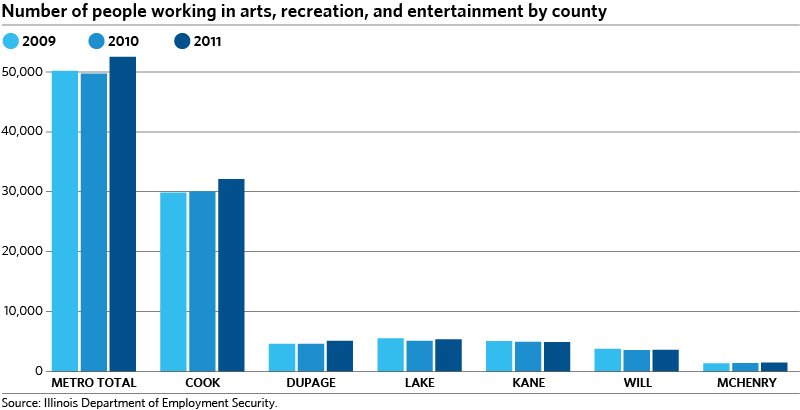
Jobs in the arts, entertainment, and recreation industries are indicators of the vibrancy of a community's arts and culture.
| 2009 | 2010 | 2011 | |
| Metro Total | 50,185 | 49,724 | 52,514 |
| Cook | 29,860 | 30,070 | 32,119 |
| Du PAGE | 4,605 | 4,621 | 5,099 |
| LAKE | 5,527 | 5,123 | 5,352 |
| KANE | 5,076 | 4,954 | 4,894 |
| WILL | 3,751 | 3,544 | 3,588 |
| MC HENRY | 1,366 | 1,412 | 1,462 |
Arts Diversity Index (City of Chicago)
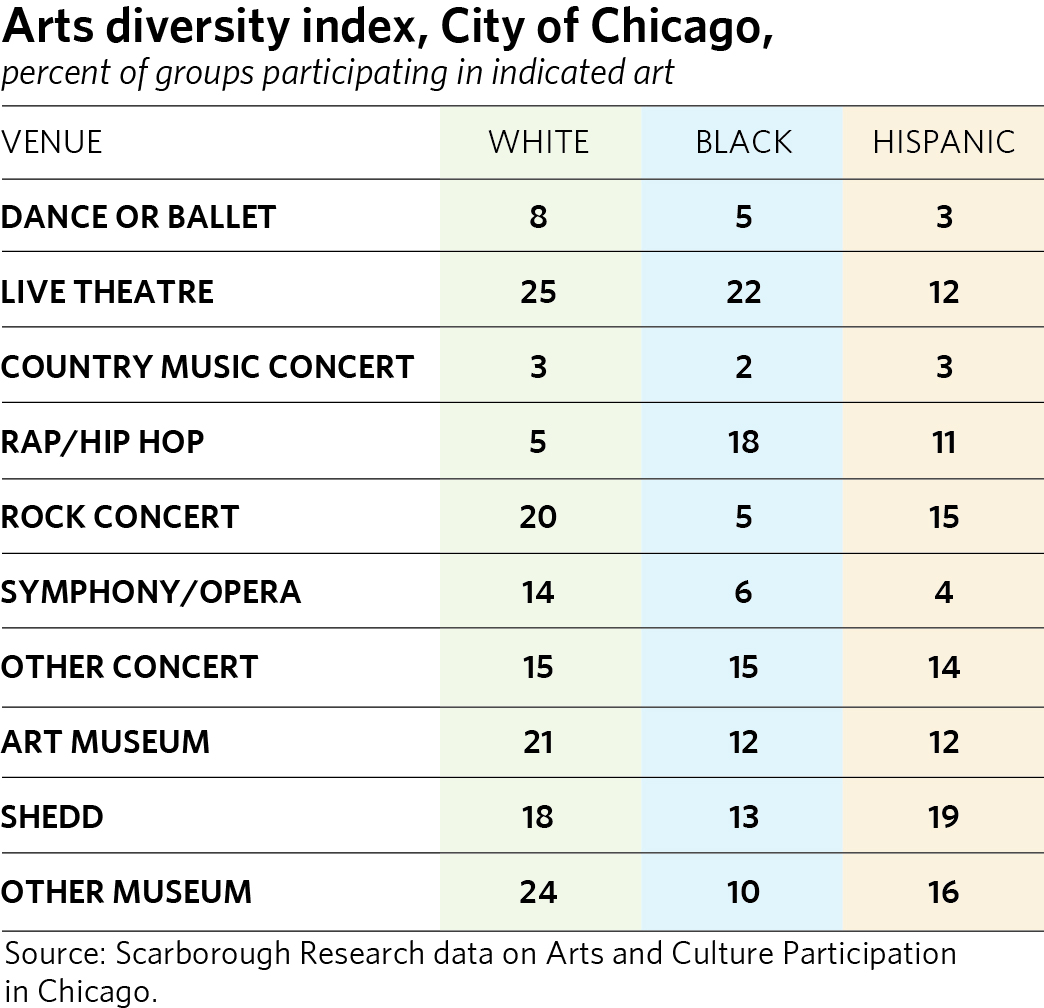
An index can be constructed that indicates the diversity of audience for various art forms in Chicago. These range from pop music forms, to museums, to theatre and classical music. The index presented here ranges from a possible score of "0", which would indicate complete parity or diversity in artistic attendance across forms, to a possible score of "100," which would indicate that racial groups have completely different attendance patterns.
| Venue | White | Black | Hispanic |
| Dance or ballet | 8 | 5 | 3 |
| Live theatre | 25 | 22 | 12 |
| Country music concert | 3 | 2 | 3 |
| Rap/Hip Hop | 5 | 18 | 11 |
| Rock concert | 20 | 5 | 15 |
| Symphony/Opera | 14 | 6 | 4 |
| Other concert | 15 | 15 | 14 |
| Art museum | 21 | 12 | 12 |
| Shedd | 18 | 13 | 19 |
| Other museum | 24 | 10 | 16 |
SOURCE: Scarborough Research data on Arts and Culture Participation in the City of Chicago
metropulse - Sustainable Development
Sustainable Development
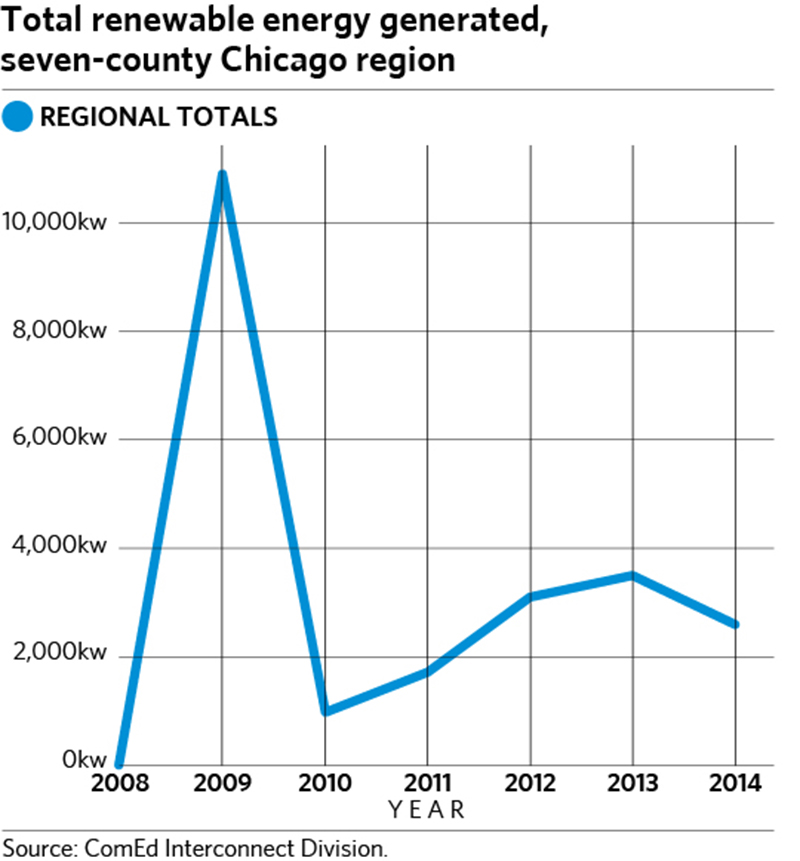
GOTO 2040 recommends that communities seek out opportunities to foster renewable energy generation, particularly small-scale "distributed" systems that can be deployed at local homes and businesses. As the plan describes, this is a complex and evolving enterprise that requires considerable technological and policy innovation. However, communities in the seven-county region are making slow and steady progress towards a cleaner and more decentralized energy supply mix.
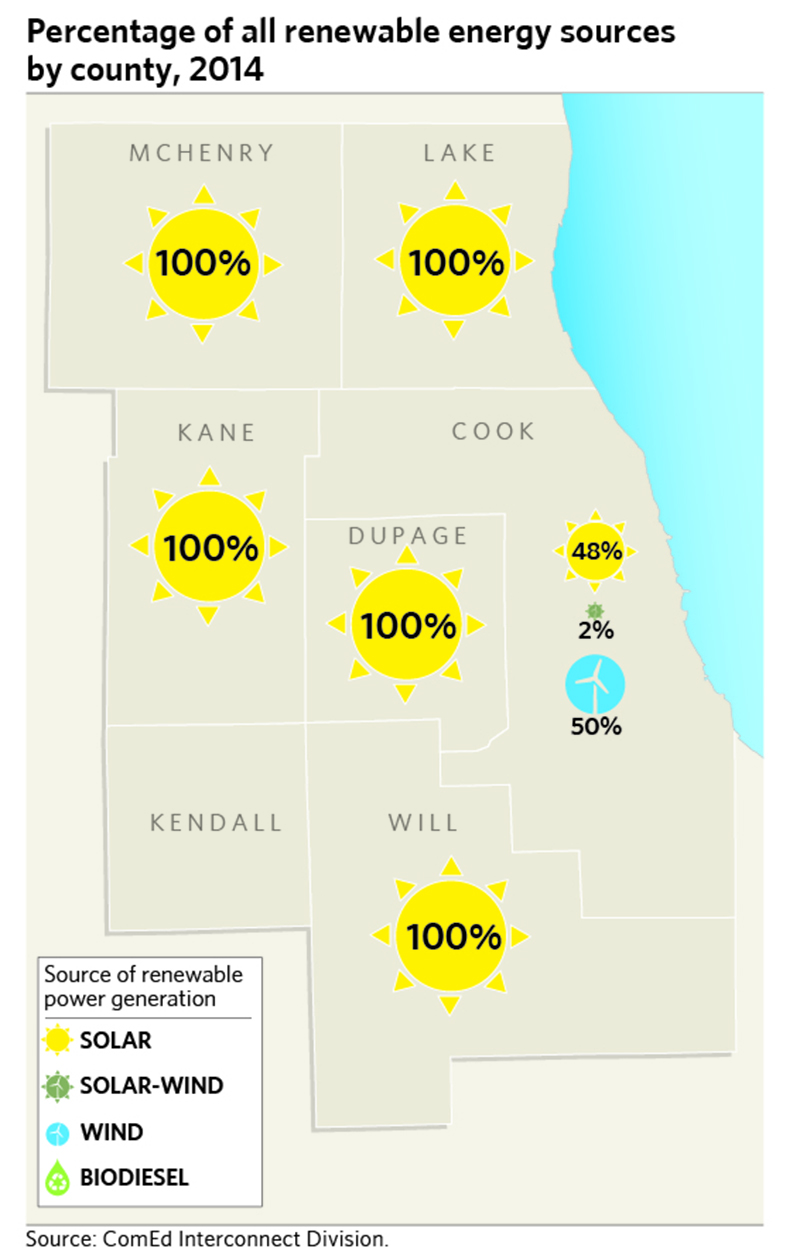
The charts highlight the number of solar, wind , solar/wind combined and biodiesel energy "grid interconnections" reported by Com Ed, which manages the distribution grid in most of the seven-county region (aside from a small portion of Kendall County and a handful of municipalities). The chart to the right shows that the total number of renewable energy systems in the region remains relatively modest, but that the pace of installations is increasing. The 2009 spike in solar capacity was largely driven by the completion of Exelon's City Solar project, a 10 MW solar farm installed on a 41-acre brownfield in the West Pullman neighborhood on the south side of Chicago.
There are several state policy and municipal initiatives underway that could have a dramatic effect on the pace of renewable energy development in the seven-county region. If these initiatives are successful, 2014 could be a "tipping point" for renewables that will have a lasting positive impact on the region's job market, economy and environment.
| Total Renewable Energy by Year: Seven County Region | ||
| Commissioning Year | Energy Source | Sum of Total Capacity (kw) |
| 2008 | Solar Total | 55.3 |
| Wind Total | 82 | |
| 2008 Total | 137.3 | |
| 2009 | Solar Total | 10339.6 |
| Wind Total | 725.92 | |
| 2009 Total | 11065.52 | |
| 2010 | Solar Total | 780.68 |
| Solar/Wind Total | 5.8 | |
| Wind Total | 171.2 | |
| 2010 Total | 957.68 | |
| 2011 | Solar Total | 703.055 |
| Solar/Wind Total | 838.2 | |
| Wind Total | 225.9 | |
| 2011 Total | 1767.155 | |
| 2012 | Solar Total | 3013.56 |
| Solar/Wind Total | 13.6 | |
| Wind Total | 104.8 | |
| 2012 Total | 3131.96 | |
| 2013 | ||
| Bio-Diesel Total | 20 | |
| Solar Total | 3250.145 | |
| Solar/Wind Total | 186 | |
| 2013 Total | 3456.145 | |
| Grand Total | 20515.76 | |
| Facility County | Commissioning Year | Energy Source | Count of Energy Source | Sum of Total Capacity (kw) |
| Cook | 2008 | |||
| Solar Total | 10 | 32 | ||
| Wind Total | 1 | 13.2 | ||
| 2008 Total | 11 | 45.2 | ||
| 2009 | ||||
| Solar Total | 21 | 10219.36 | ||
| Wind Total | 6 | 156.9 | ||
| 2009 Total | 27 | 10376.26 | ||
| 2010 | ||||
| Solar Total | 44 | 376.69 | ||
| Wind Total | 4 | 12.9 | ||
| 2010 Total | 48 | 389.59 | ||
| 2011 | ||||
| Solar Total | 62 | 295.395 | ||
| Solar/Wind Total | 4 | 838.2 | ||
| Wind Total | 6 | 122 | ||
| 2011 Total | 72 | 1255.595 | ||
| 2012 | ||||
| Solar Total | 69 | 1422.89 | ||
| 2012 Total | 69 | 1422.89 | ||
| 2013 | ||||
| Solar Total | 71 | 2768.705 | ||
| Solar/Wind Total | 1 | 186 | ||
| 2013 Total | 72 | 2954.705 | ||
| Cook Total | 299 | 16444.24 | ||
| Dupage | ||||
| 2008 Total | Solar Total | 1 | 1.02 | |
| 2009 Total | Solar Total | 5 | 17.2 | |
| 2010 | ||||
| Solar Total | 10 | 219.6 | ||
| Solar/Wind Total | 1 | 4.2 | ||
| Wind Total | 2 | 6 | ||
| 2010 Total | 13 | 229.8 | ||
| 2011 Total | Solar Total | 6 | 79.22 | |
| 2012 Total | Solar Total | 15 | 247.85 | |
| 2013 Total | Solar Total | 11 | 239.46 | |
| Dupage Total |
|
51 | 814.55 | |
| Kane | 2009 | |||
| Solar Total | 2 | 6.8 | ||
| Wind Total | 2 | 12.4 | ||
| 2009 Total | 4 | 19.2 | ||
| 2010 | ||||
| Solar Total | 2 | 10 | ||
| Wind Total | 2 | 26.4 | ||
| 2010 Total | 4 | 36.4 | ||
| 2011 | ||||
| Solar Total | 10 | 156.86 | ||
| Wind Total | 3 | 18 | ||
| 2011 Total | 13 | 174.86 | ||
| 2012 | ||||
| Solar Total | 2 | 13.6 | ||
| Wind Total | 1 | 2.4 | ||
| 2012 Total | 3 | 16 | ||
| 2013 | ||||
| Bio-Diesel Total | 1 | 20 | ||
| Solar Total | 4 | 110.18 | ||
| 2013 Total | 5 | 130.18 | ||
| Kane Total | 29 | 376.64 | ||
| Kendall | ||||
| 2008 Total | Solar Total | 1 | 3.26 | |
| 2010 Total | Wind Total | 2 | 12 | |
| 2011 Total | Solar Total | 3 | 20.96 | |
| 2012 | ||||
| Solar Total | 2 | 9.8 | ||
| Solar/Wind Total | 1 | 6.7 | ||
| 2012 Total | 3 | 16.5 | ||
| Kendall Total | 9 | 52.72 | ||
| Lake | 2008 | |||
| Solar Total | 1 | 3 | ||
| Wind Total | 1 | 5.2 | ||
| 2008 Total | 2 | 8.2 | ||
| 2009 | ||||
| Solar Total | 8 | 47.24 | ||
| Wind Total | 2 | 13.02 | ||
| 2009 Total | 10 | 60.26 | ||
| 2010 | ||||
| Solar Total | 9 | 48.85 | ||
| Wind Total | 2 | 69.3 | ||
| 2010 Total | 11 | 118.15 | ||
| 2011 Total | Solar Total | 9 | 46.18 | |
| 2012 | ||||
| Solar Total | 10 | 80.81 | ||
| Wind Total | 1 | 100 | ||
| 2012 Total | 11 | 180.81 | ||
| 2013 Total | Solar Total | 13 | 92.1 | |
| Lake Total | 56 | 505.7 | ||
| McHenry | 2008 | |||
| Solar Total | 4 | 16.02 | ||
| Wind Total | 3 | 61.8 | ||
| 2008 Total | 7 | 77.82 | ||
| 2009 | ||||
| Solar Total | 2 | 49 | ||
| Wind Total | 7 | 531.4 | ||
| 2009 Total | 9 | 580.4 | ||
| 2010 | ||||
| Solar Total | 3 | 53 | ||
| Wind Total | 3 | 16.8 | ||
| Wind and Solar Total | 1 | 1.6 | ||
| 2010 Total | 7 | 71.4 | ||
| 2011 | ||||
| Solar Total | 8 | 60.35 | ||
| Wind Total | 3 | 15.5 | ||
| 2011 Total | 11 | 75.85 | ||
| 2012 | ||||
| Solar Total | 3 | 31.3 | ||
| Solar/Wind Total | 2 | 6.9 | ||
| 2012 Total | 5 | 38.2 | ||
| 2013 Total | Solar Total | 3 | 19 | |
| McHenry Total | 42 | 862.67 | ||
| Will | ||||
| 2008 Total | Wind Total | 1 | 1.8 | |
| 2009 Total | Wind Total | 3 | 12.2 | |
| 2010 | ||||
| Solar Total | 3 | 72.54 | ||
| Wind Total | 4 | 27.8 | ||
| 2010 Total | 7 | 100.34 | ||
| 2011 | ||||
| Solar Total | 7 | 44.09 | ||
| Wind Total | 2 | 70.4 | ||
| 2011 Total | 9 | 114.49 | ||
| 2012 | ||||
| Solar Total | 11 | 1207.31 | ||
| Wind Total | 1 | 2.4 | ||
| 2012 Total | 12 | 1209.71 | ||
| 2013 Total | Solar Total | 3 | 20.7 | |
| Will Total | 35 | 1459.24 | ||
| GRAND TOTAL | 521 | 20515.76 |
SOURCE: ComEd Interconnect Division