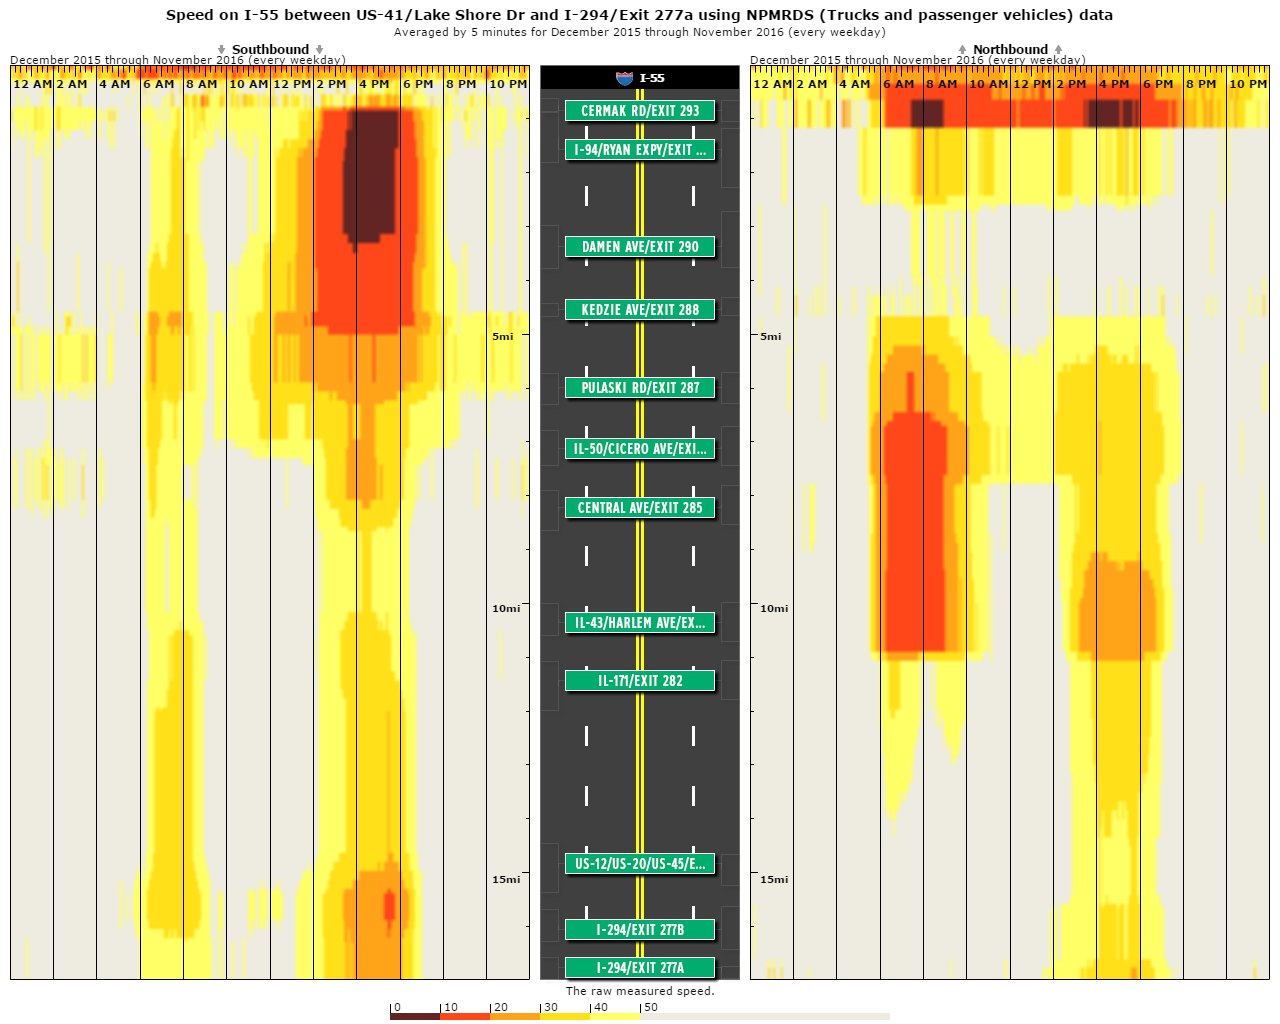
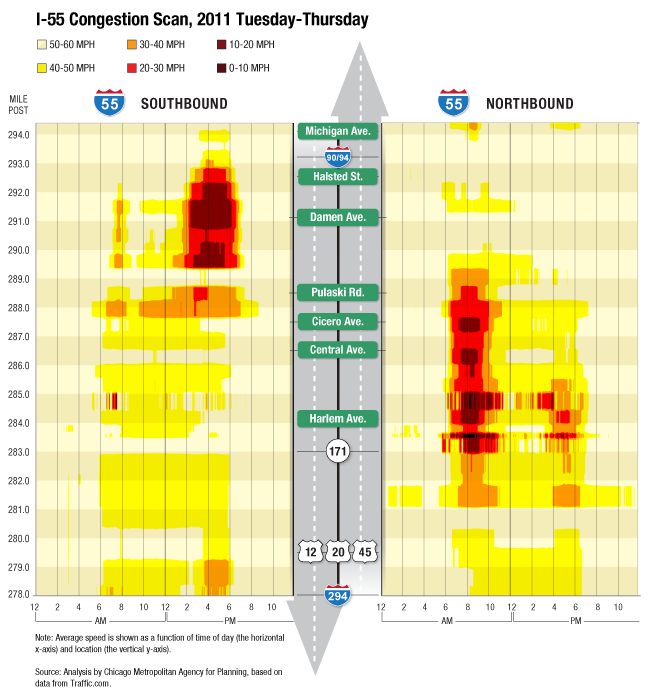
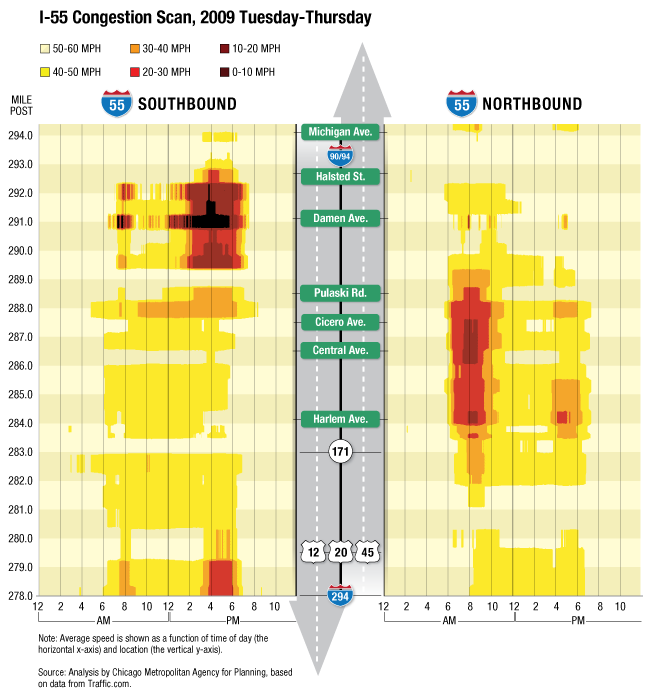
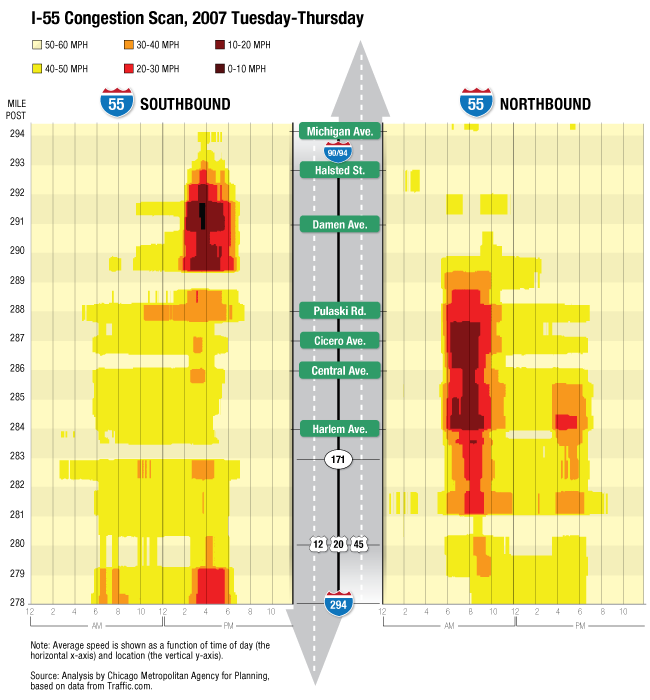
The Chicago region traffic congestion scans were created by averaging five minute speed data obtained from freeway loop detectors, radar, and mobile technology data. The traffic scans display average speed on a freeway corridor as a function of time of day (the x-axis) and location (the y-axis) along a freeway corridor.
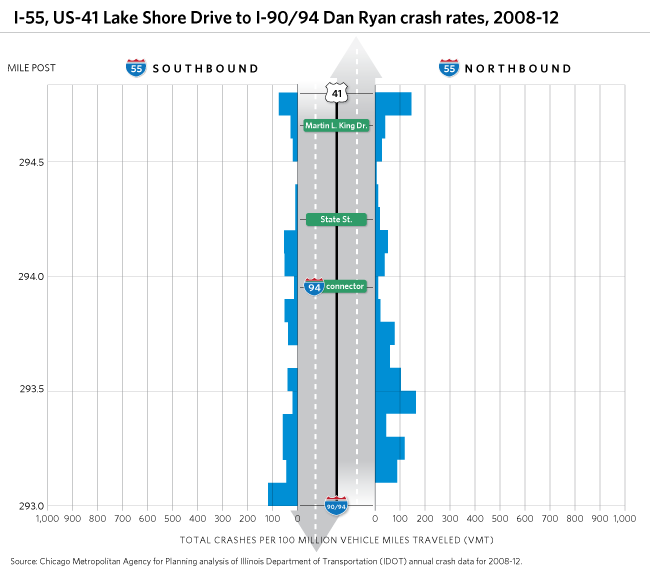
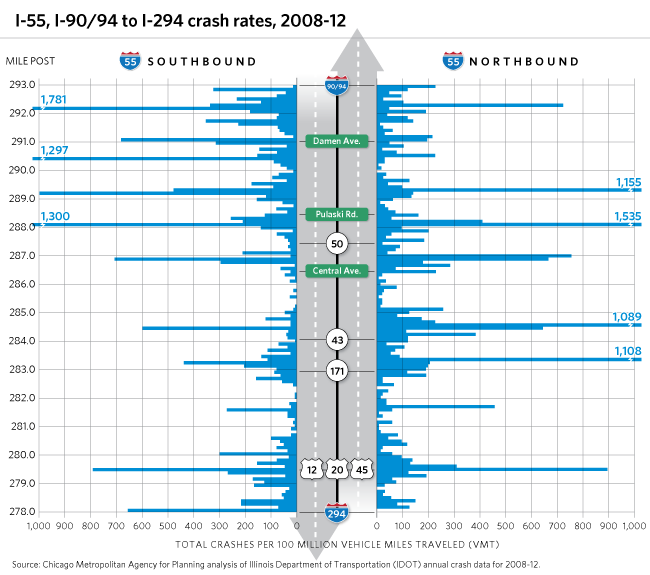
Crash scans show the rate of total highway crashes per 100 million vehicle-miles traveled (VMT) for 1/10 mile segments. The purpose of these crash scans is to show highway planners and system managers how crashes are related to congestion. Understanding where crashes are concentrated can help planners and engineers focus on improving those locations with the worst performance.