The Chicago region traffic congestion scans were created by averaging five minute speed data obtained from freeway loop detectors, radar, and mobile technology data. The traffic scans display average speed on a freeway corridor as a function of time of day (the x-axis) and location (the y-axis) along a freeway corridor.
I-90 94 Dan Ryan Expressway Express Lanes I-90 Skyway to I-55
Feb 4, 2014
I-90/94 Dan Ryan Expressway (Express Lanes I-90 Skyway to I-55) Congestion Scans
Congestion Scans
I-90/94, Dan Ryan Express Lanes, from 31st Street to I-90 Chicago Skyway. Congestion Scans, 2016. Showing average speed by milepost by time of day.
Note: for best viewing, in Chrome, right-click on the graphic, then open in a new tab. In other browsers, the image may be saved or downloaded as a PDF below.
Eastbound:
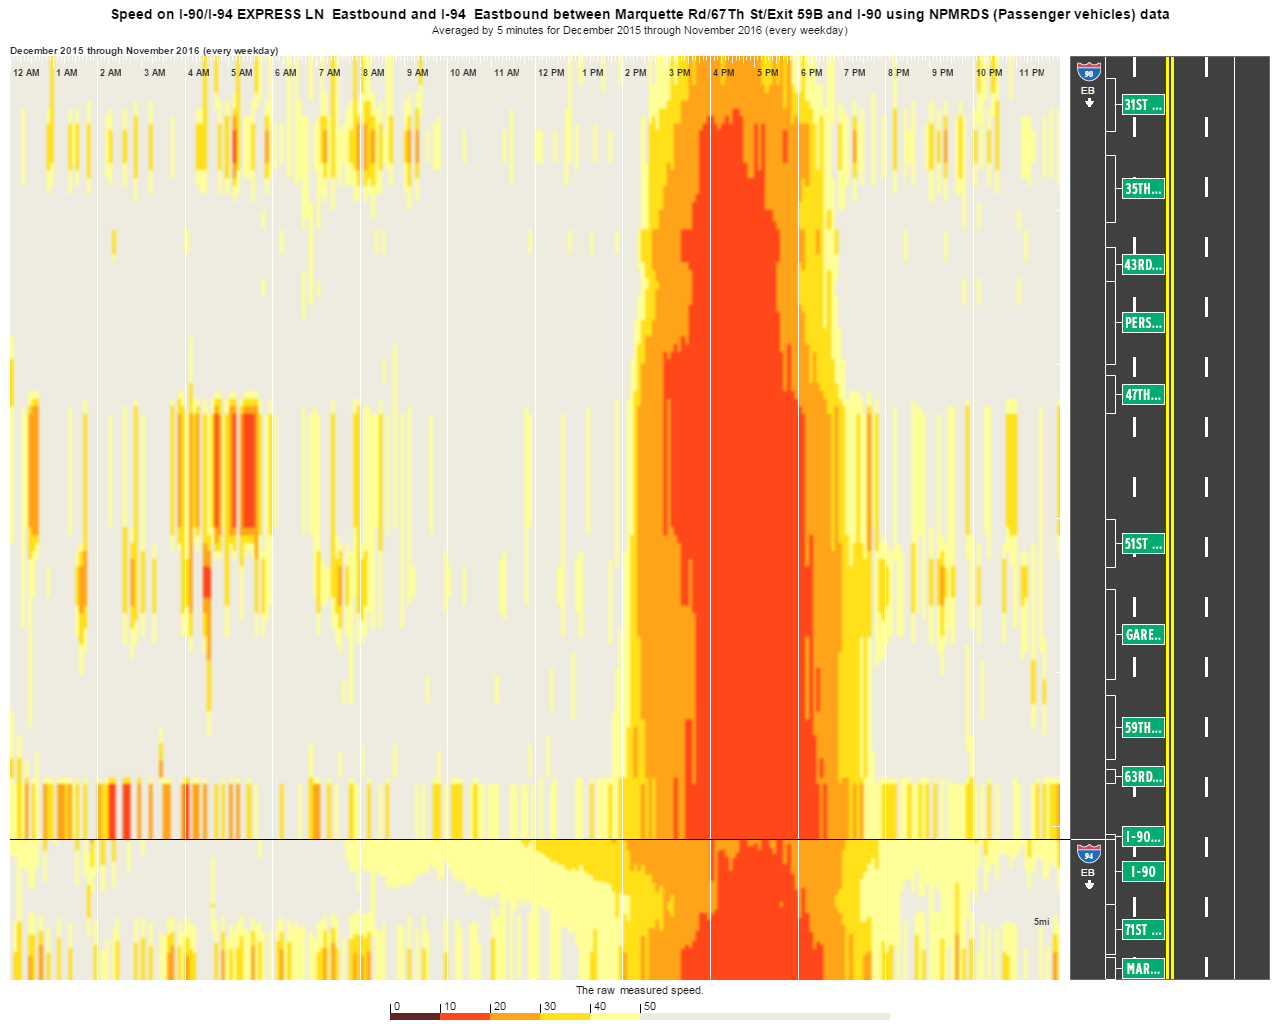
Download high resolution PDF, eastbound (passenger vehicles only, as above)
Westbound:
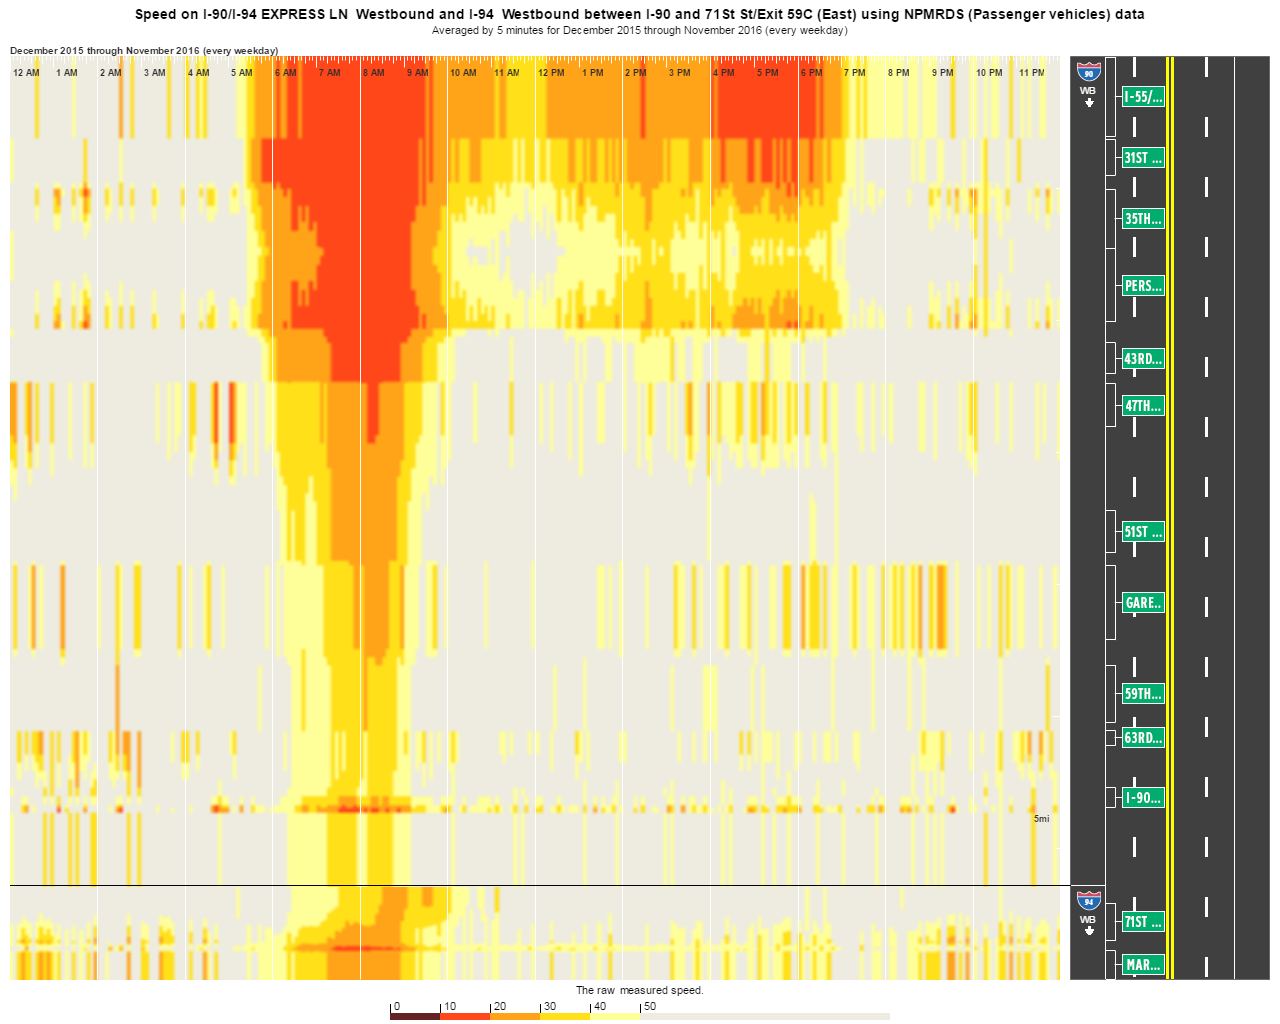
Download high-resolution PDF, westbound (passenger vehicles only, as above).
Not: Trucks are not permitted on the I-90/94 express lanes, so no truck congestion scan was produced for this segment.
Performance Data
2007 performance measures are unavailable for this highway segment because of construction activity at the time. Performance measures will be produced for subsequent years when data is available.
Non-holiday Tuesdays, Wednesdays, and Thursdays:
East-bound I-90/94 Dan Ryan Express Lanes
| Measure | 2008 | 2009 | 2010 | 2011 |
|---|---|---|---|---|
|
Free-Flow Travel Time (Minutes) |
|
3.75 | 4.10 | 4.48 |
|
Average AM Peak-Period Travel Time (Minutes) |
|
4.21 | 4.51 | 4.72 |
| AM Travel Time Index |
|
1.12 | 1.10 | 1.06 |
|
Average PM Peak-Period Travel Time (Minutes) |
|
4.52 | 4.95 | 7.24 |
| PM Travel Time Index |
|
1.21 | 1.21 | 1.62 |
|
AM Peak-Period 95th Percentile Travel Time (Minutes) |
|
5.26 | 5.46 | 5.40 |
|
AM Peak-Period |
|
1.40 | 1.33 | 1.21 |
|
PM Peak-Period 95th Percentile Travel Time (Minutes) |
|
6.36 | 5.72 | 10.05 |
|
PM Peak-Period Planning Time Index |
|
1.70 | 1.40 | 2.24 |
| Congested Hours |
|
0.68 | .34 | 7.70 |
West-bound I-90/94 Dan Ryan Express Lanes
| Measure |
2008 |
2009 | 2010 | 2011 |
|---|---|---|---|---|
|
Free-Flow Travel Time (Minutes) |
|
3.75 | 4.27 | 4.39 |
|
Average AM Peak-Period Travel Time (Minutes) |
|
4.77 | 5.38 | 4.97 |
| AM Travel Time Index |
|
1.27 | 1.26 | 1.13 |
|
Average PM Peak-Period Travel Time (Minutes) |
|
4.13 | 4.73 | 4.74 |
| PM Travel Time Index |
|
1.10 | 1.11 | 1.08 |
|
AM Peak-Period 95th Percentile Travel Time (Minutes) |
|
7.76 | 6.46 | 6.04 |
|
AM Peak-Period |
|
2.07 | 1.51 | 1.38 |
|
PM Peak-Period 95th Percentile Travel Time (Minutes) |
|
5.26 | 6.16 | 5.82 |
|
PM Peak-Period Planning Time Index |
|
1.40 | 1.44 | 1.33 |
| Congested Hours |
|
1.08 | 1.74 | 5.18 |
About the Data
2016 scans were prepared using the RITIS system, developed by the University of Maryland's CATT Lab. Data comes from the National Performance Measure Research Dataset (NPMRDS), a HERE dataset made available to states and MPOs through the Freight Management and Operations Program of the Federal Highway Administration.
Notice: 2016 congestion scans are based upon work supported by the Federal Highway Administration under contract number DTFH-13-C-00012. Any opinions, findings, and conclusions or recommendations expressed in this publication are those of the author(s) and do not reflect the views of the Federal Highway Administration.
Feb 4, 2014
I-90/94 Dan Ryan Expressway (Express Lanes I-90 Skyway to I-55) Congestion Scans
The Chicago region traffic congestion scans were created by averaging five minute speed data obtained from freeway loop detectors, radar, and mobile technology data. The traffic scans display average speed on a freeway corridor as a function of time of day (the x-axis) and location (the y-axis) along a freeway corridor.
Congestion Scans
I-90/94, Dan Ryan Express Lanes, from 31st Street to I-90 Chicago Skyway. Congestion Scans, 2016. Showing average speed by milepost by time of day.
Note: for best viewing, in Chrome, right-click on the graphic, then open in a new tab. In other browsers, the image may be saved or downloaded as a PDF below.
Eastbound:
Download high resolution PDF, eastbound (passenger vehicles only, as above)
Westbound:
Download high-resolution PDF, westbound (passenger vehicles only, as above).
Not: Trucks are not permitted on the I-90/94 express lanes, so no truck congestion scan was produced for this segment.
Performance Data
2007 performance measures are unavailable for this highway segment because of construction activity at the time. Performance measures will be produced for subsequent years when data is available.
Non-holiday Tuesdays, Wednesdays, and Thursdays:
East-bound I-90/94 Dan Ryan Express Lanes
| Measure | 2008 | 2009 | 2010 | 2011 |
|---|---|---|---|---|
|
Free-Flow Travel Time (Minutes) |
|
3.75 | 4.10 | 4.48 |
|
Average AM Peak-Period Travel Time (Minutes) |
|
4.21 | 4.51 | 4.72 |
| AM Travel Time Index |
|
1.12 | 1.10 | 1.06 |
|
Average PM Peak-Period Travel Time (Minutes) |
|
4.52 | 4.95 | 7.24 |
| PM Travel Time Index |
|
1.21 | 1.21 | 1.62 |
|
AM Peak-Period 95th Percentile Travel Time (Minutes) |
|
5.26 | 5.46 | 5.40 |
|
AM Peak-Period |
|
1.40 | 1.33 | 1.21 |
|
PM Peak-Period 95th Percentile Travel Time (Minutes) |
|
6.36 | 5.72 | 10.05 |
|
PM Peak-Period Planning Time Index |
|
1.70 | 1.40 | 2.24 |
| Congested Hours |
|
0.68 | .34 | 7.70 |
West-bound I-90/94 Dan Ryan Express Lanes
| Measure |
2008 |
2009 | 2010 | 2011 |
|---|---|---|---|---|
|
Free-Flow Travel Time (Minutes) |
|
3.75 | 4.27 | 4.39 |
|
Average AM Peak-Period Travel Time (Minutes) |
|
4.77 | 5.38 | 4.97 |
| AM Travel Time Index |
|
1.27 | 1.26 | 1.13 |
|
Average PM Peak-Period Travel Time (Minutes) |
|
4.13 | 4.73 | 4.74 |
| PM Travel Time Index |
|
1.10 | 1.11 | 1.08 |
|
AM Peak-Period 95th Percentile Travel Time (Minutes) |
|
7.76 | 6.46 | 6.04 |
|
AM Peak-Period |
|
2.07 | 1.51 | 1.38 |
|
PM Peak-Period 95th Percentile Travel Time (Minutes) |
|
5.26 | 6.16 | 5.82 |
|
PM Peak-Period Planning Time Index |
|
1.40 | 1.44 | 1.33 |
| Congested Hours |
|
1.08 | 1.74 | 5.18 |
About the Data
2016 scans were prepared using the RITIS system, developed by the University of Maryland's CATT Lab. Data comes from the National Performance Measure Research Dataset (NPMRDS), a HERE dataset made available to states and MPOs through the Freight Management and Operations Program of the Federal Highway Administration.
Notice: 2016 congestion scans are based upon work supported by the Federal Highway Administration under contract number DTFH-13-C-00012. Any opinions, findings, and conclusions or recommendations expressed in this publication are those of the author(s) and do not reflect the views of the Federal Highway Administration.