Tracking performance and making adjustments to reach the region's desired future is critical to the implementation of GO TO 2040. Through the Regional Indicators Project and its data portal MetroPulse, CMAP and The Chicago Community Trust created metrics for measuring economic, environmental, social, and cultural variables that are essential for sustainable prosperity. Since its launch, CMAP has continued to acquire new data sets so that data about issues — transportation, housing, and natural resources, for example — can be accessed for varying geographic levels. This commitment adds value to planning, analysis, and governance activities in our region.
In winter 2008, CMAP's Board of Directors approved more than 200 preliminary tracking indicators to measure the implementation of GO TO 2040. Several indicators required a detailed understanding of municipal policies in the region. Simultaneously, GO TO 2040 strategy papers were being developed with the recognition that many plan recommendations would be implemented at the local level. Therefore, for the purpose of measuring plan implementation, there was need for a baseline measurement of which potential GO TO 2040 strategies were already in effect through municipal plans, policies, or programs.
CMAP staff conducted a survey of municipal staff, who were asked to answer specific questions about local planning and policies. In the spring and summer of 2010, that survey was distributed to mayors, managers, and directors. Survey results are described below, and you may delve further into some of the data at MetroPulse. Also see the second installment in this two-part Policy Update.
Methodology and Response
The 2010 CMAP Municipal Plans, Programs, and Operations Survey was drafted by CMAP staff and tested among a small group of municipal staff who suggested revisions and gave very important feedback as to how data collection should take place. The final questionnaire was 13 pages long and covered a broad range of topics, from land use, the environment, housing, and transportation policy to taxes and fees, comprehensive planning, technical assistance, data distribution, and structure.
The survey's response rate was 74 percent, with 211 of the region's 284 municipalities submitting completed surveys (shown in the map below). Municipalities that responded collectively represent 94 percent of the entire region's population, and 91 percent of the suburban population (excluding the City of Chicago).
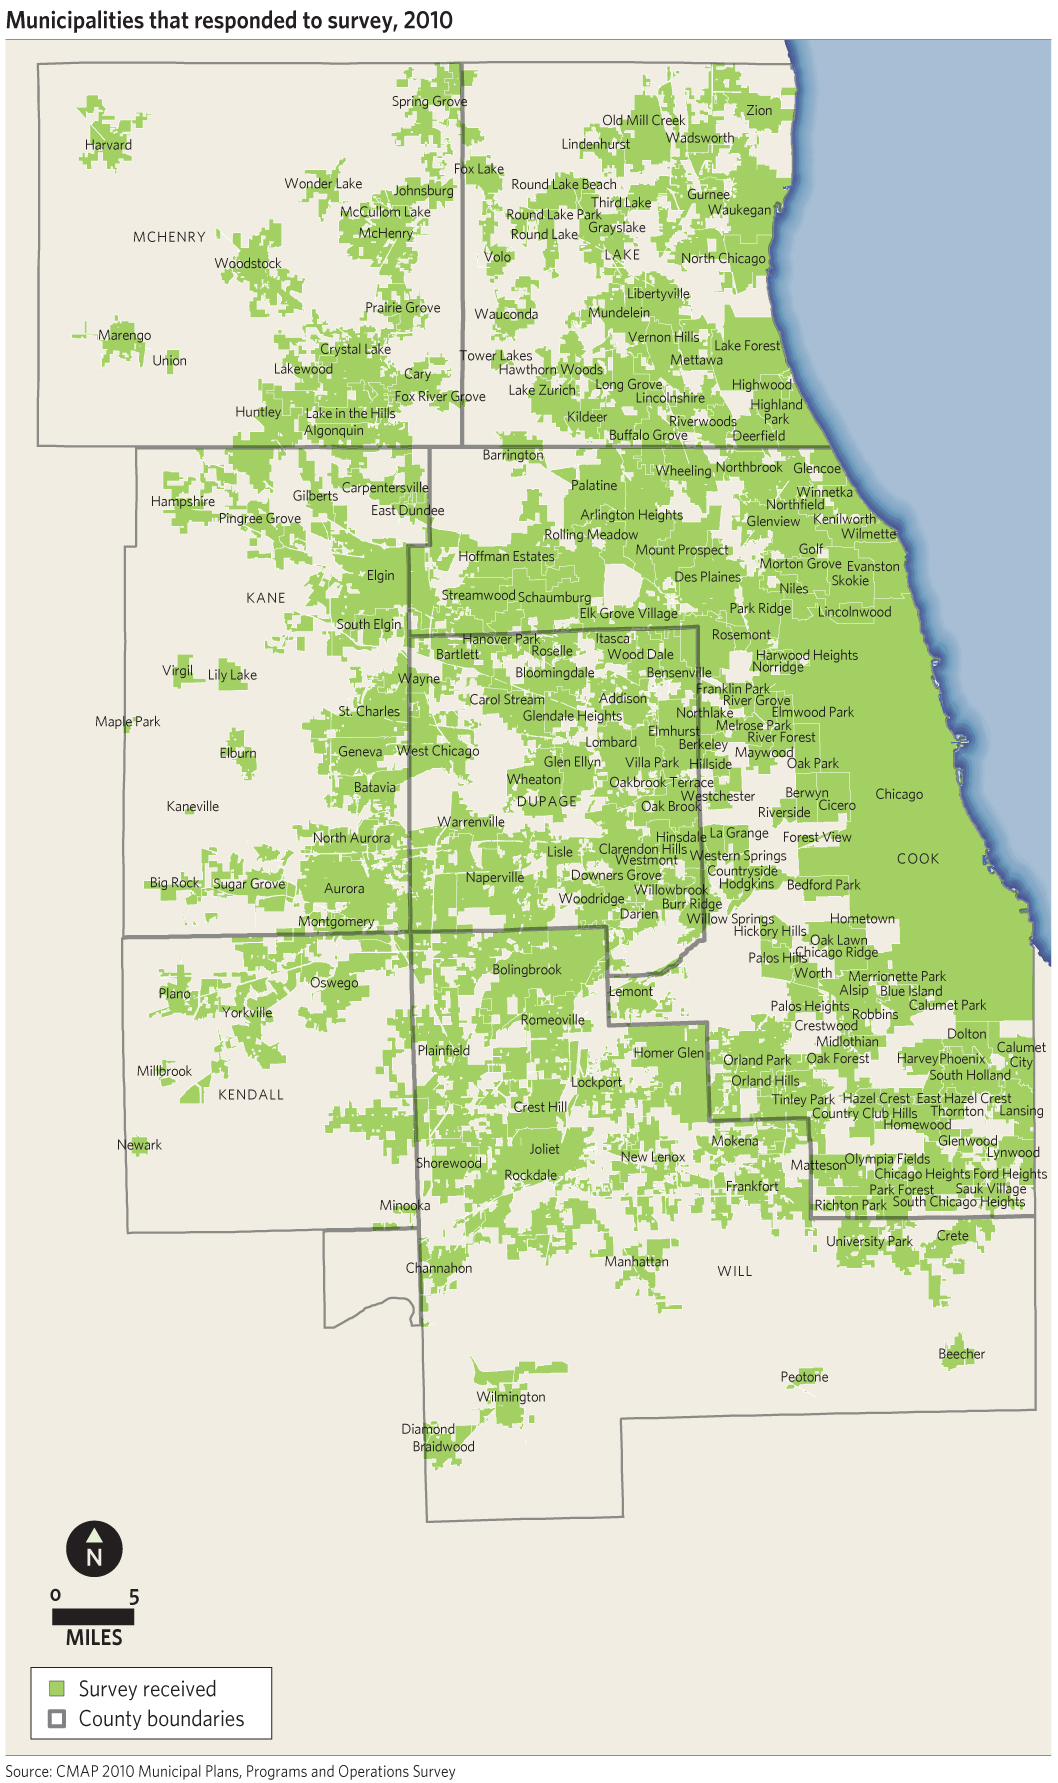
No scientific sampling was done, so the conclusions drawn in this two-part Policy Update series should be considered representative of only the municipalities that responded. The findings can only be considered suggestive of municipal policy around the region.
Findings
Only broad findings will be highlighted in this Policy Update. While 211 surveys were submitted, many respondents chose not to answer one or more questions. Throughout this update, links are provided to show where this data (when available) is available through MetroPulse.
Linking Land Use and Transportation
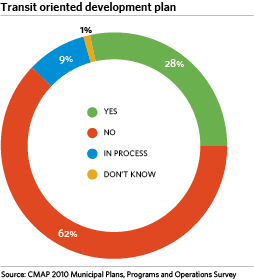
An important GO TO 2040 recommendation for municipalities is that local land use decisions should focus on the interrelationship of transportation, land use, and housing, with an emphasis on development patterns that support the use of public transit. The 2010 Municipal Plans, Programs, and Operations Survey helped establish a baseline for if and how municipalities are planning as such by asking about adoption of transit oriented development (TOD) plans, as well as the prevalence of mixed-use development and the frequency of zoning ordinance amendments.
Of the 211 municipalities submitting questionnaires, 78 reported that they either have a TOD plan in place or are in the process of adopting one. For municipalities who reported that their TOD plan is in process, the anticipated completion dates ranged between 2010 and 2014. It is difficult to tell how representative these numbers are, as not every municipality is served by transit. However, it is quite useful as a baseline for planning purposes.
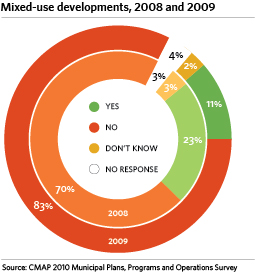
GO TO 2040 also supports mixed-use development. The definition of "mixed use" varies between communities, sometimes referring to a combination of land uses (e.g., residential, office, or retail) within a single structure or on the same block, while at other times referring to simply connections between residential and commercial areas of a community. While less than a quarter of responding municipalities had existing plans for mixed-use developments in 2008, that number declined by about 50 percent (from 49 to 24 municipalities) by 2009.
Ordinances, codes, and other regulations, especially when not updated regularly, often make it more difficult to build compact, mixed-use development instead of single-use subdivisions. Interestingly, the beginning of the recession seemed to have little impact on the number of municipalities who amended the text of their zoning ordinances between 2009 and 2009.
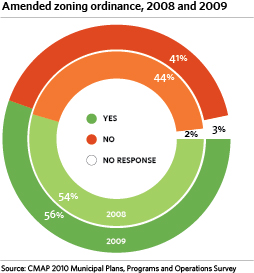
CMAP plans to measure the success of efforts at data sharing and transparency by tracking two data sets that should be made available by municipalities -- one of which is zoning ordinances (including maps). The other is construction permits.
Environment
The survey asked several questions seeking to understand the number and percentage of municipalities that address environmental issues, such as energy and water conservation, air and water pollution, and the preservation of undeveloped areas.
Thirty-nine percent of responding municipalities reported participation in at least one clean air program. The most popular program among municipalities (with 53 respondents participating) is Clean Air Counts, a collaborative between the Metropolitan Mayors Caucus (MMC), City of Chicago, U.S. Environmental Protection Agency Region 5, and Illinois Environmental Protection Agency (IEPA). The second most popular program was No Idling Zones, also developed by MMC through Clean Air Counts, with 24 municipalities reporting participation.

Brownfields are prevalent throughout the region, and although they present challenges, they are often in desirable locations with great potential for redevelopment. However, less than 20 percent of the 211 responding municipalities reported that they were aware of expenditures for brownfield remediation. Even fewer estimated the total value of funds expended, but not surprisingly, more municipalities were able to estimate the value of public expenditures.

Housing
Affordable housing can be a contentious issue. Many residents oppose it in their communities due to concerns about lowered property values, crime, and other real or perceived drawbacks. But much of this is based on perceptions of affordable housing as extremely dense concentrations of poverty — perceptions that are far removed from current realities. When affordable housing is designed well and placed in mixed-income communities, it can be indistinguishable from market-rate housing. Studies have found that proximity to affordable housing does not have a negative effect on property values, as long as the affordable housing is well-designed and planned in context with the surrounding community.
Approximately a quarter of responding municipalities reported recent involvement in affordable housing developments. Active involvement can take a variety of forms, including planned unit development for income restricted buildings and active participation in sub-regional housing collaboratives.

Two-thirds of responding municipalities reported that they have dedicated staff to address housing issues, while six percent reported that a committee or commission was specifically tasked with addressing housing issues. It is important to remember that, because the region's municipalities fall along a continuum of capacity from very high to very low, interpreting these survey results is a challenge. However, they do allow CMAP to establish a baseline of those with staff committed to housing and track that over time.

Check back next week
This two-part series of findings from the 2010 CMAP Municipal Plans, Programs, and Operations Survey findings will continue next week, including information on local comprehensive plans, technical assistance, and data distribution.