Location Affordability Index
While one GO TO 2040 indicator tracks housing and transportation affordability for the region as a whole, additional data sources provide insight into how these costs vary throughout the region. This Update examines housing and transportation costs and job access in metropolitan Chicago using the U.S. Department of Housing and Urban Development's Location Affordability Index (LAI), which uses U.S. Census American Community Survey data from 2006-10. The LAI estimates the percentage of income prototypical household types would spend on housing and transportation to locate in each U.S. Census block group in the region. The LAI delineates eight household profiles of varying incomes, family sizes, and number of commuters because affordability differs for each household type. This Update uses the LAI's Regional Typical and Low-Income household profiles, detailed in the following table.
| LAI Household Type | Household Size | Household Income | Commuters |
| Median | 2.7 | $60,754 | 1.2 |
| Low-Income | 3 | $33,800 | 1 |
Typical housing and transportation costs
The following map displays the estimated percentage of income that a typical household would spend on housing and transportation to live in each census tract in the region. In the light and dark green block groups, a typical household is estimated to spend less than 45 percent of their income on housing and transportation costs. In contrast, a typical regional household choosing to locate in the light and dark blue block groups is estimated to spend 46 percent to 85 percent of its income on housing and transportation. Overall, many areas located along major highways or with transit access have lower combined housing and transportation costs and are more affordable for a typical regional household. Areas further from the center of the region are more likely to have higher combined housing and transportation costs.

This map also identifies major employment clusters (as of 2010) using CMAP's analysis of employment data from the Illinois Department of Employment Security. Together, they contain approximately 50 percent of the region's jobs. Living close to a major job center can reduce a household's commute-driven transportation costs. Overlaying the LAI data with regional employment clusters indicates that the typical regional household would spend a lower percentage of income (between 19 percent and 45 percent) on combined housing and transportation costs near many of the major job centers. There is a cluster of job centers in Lake County, though, where a typical regional household would spend a much larger portion of its income to live. This could be due to a higher cost of housing and/or a concentration of high-income households in that area.
Combined costs for low-income households
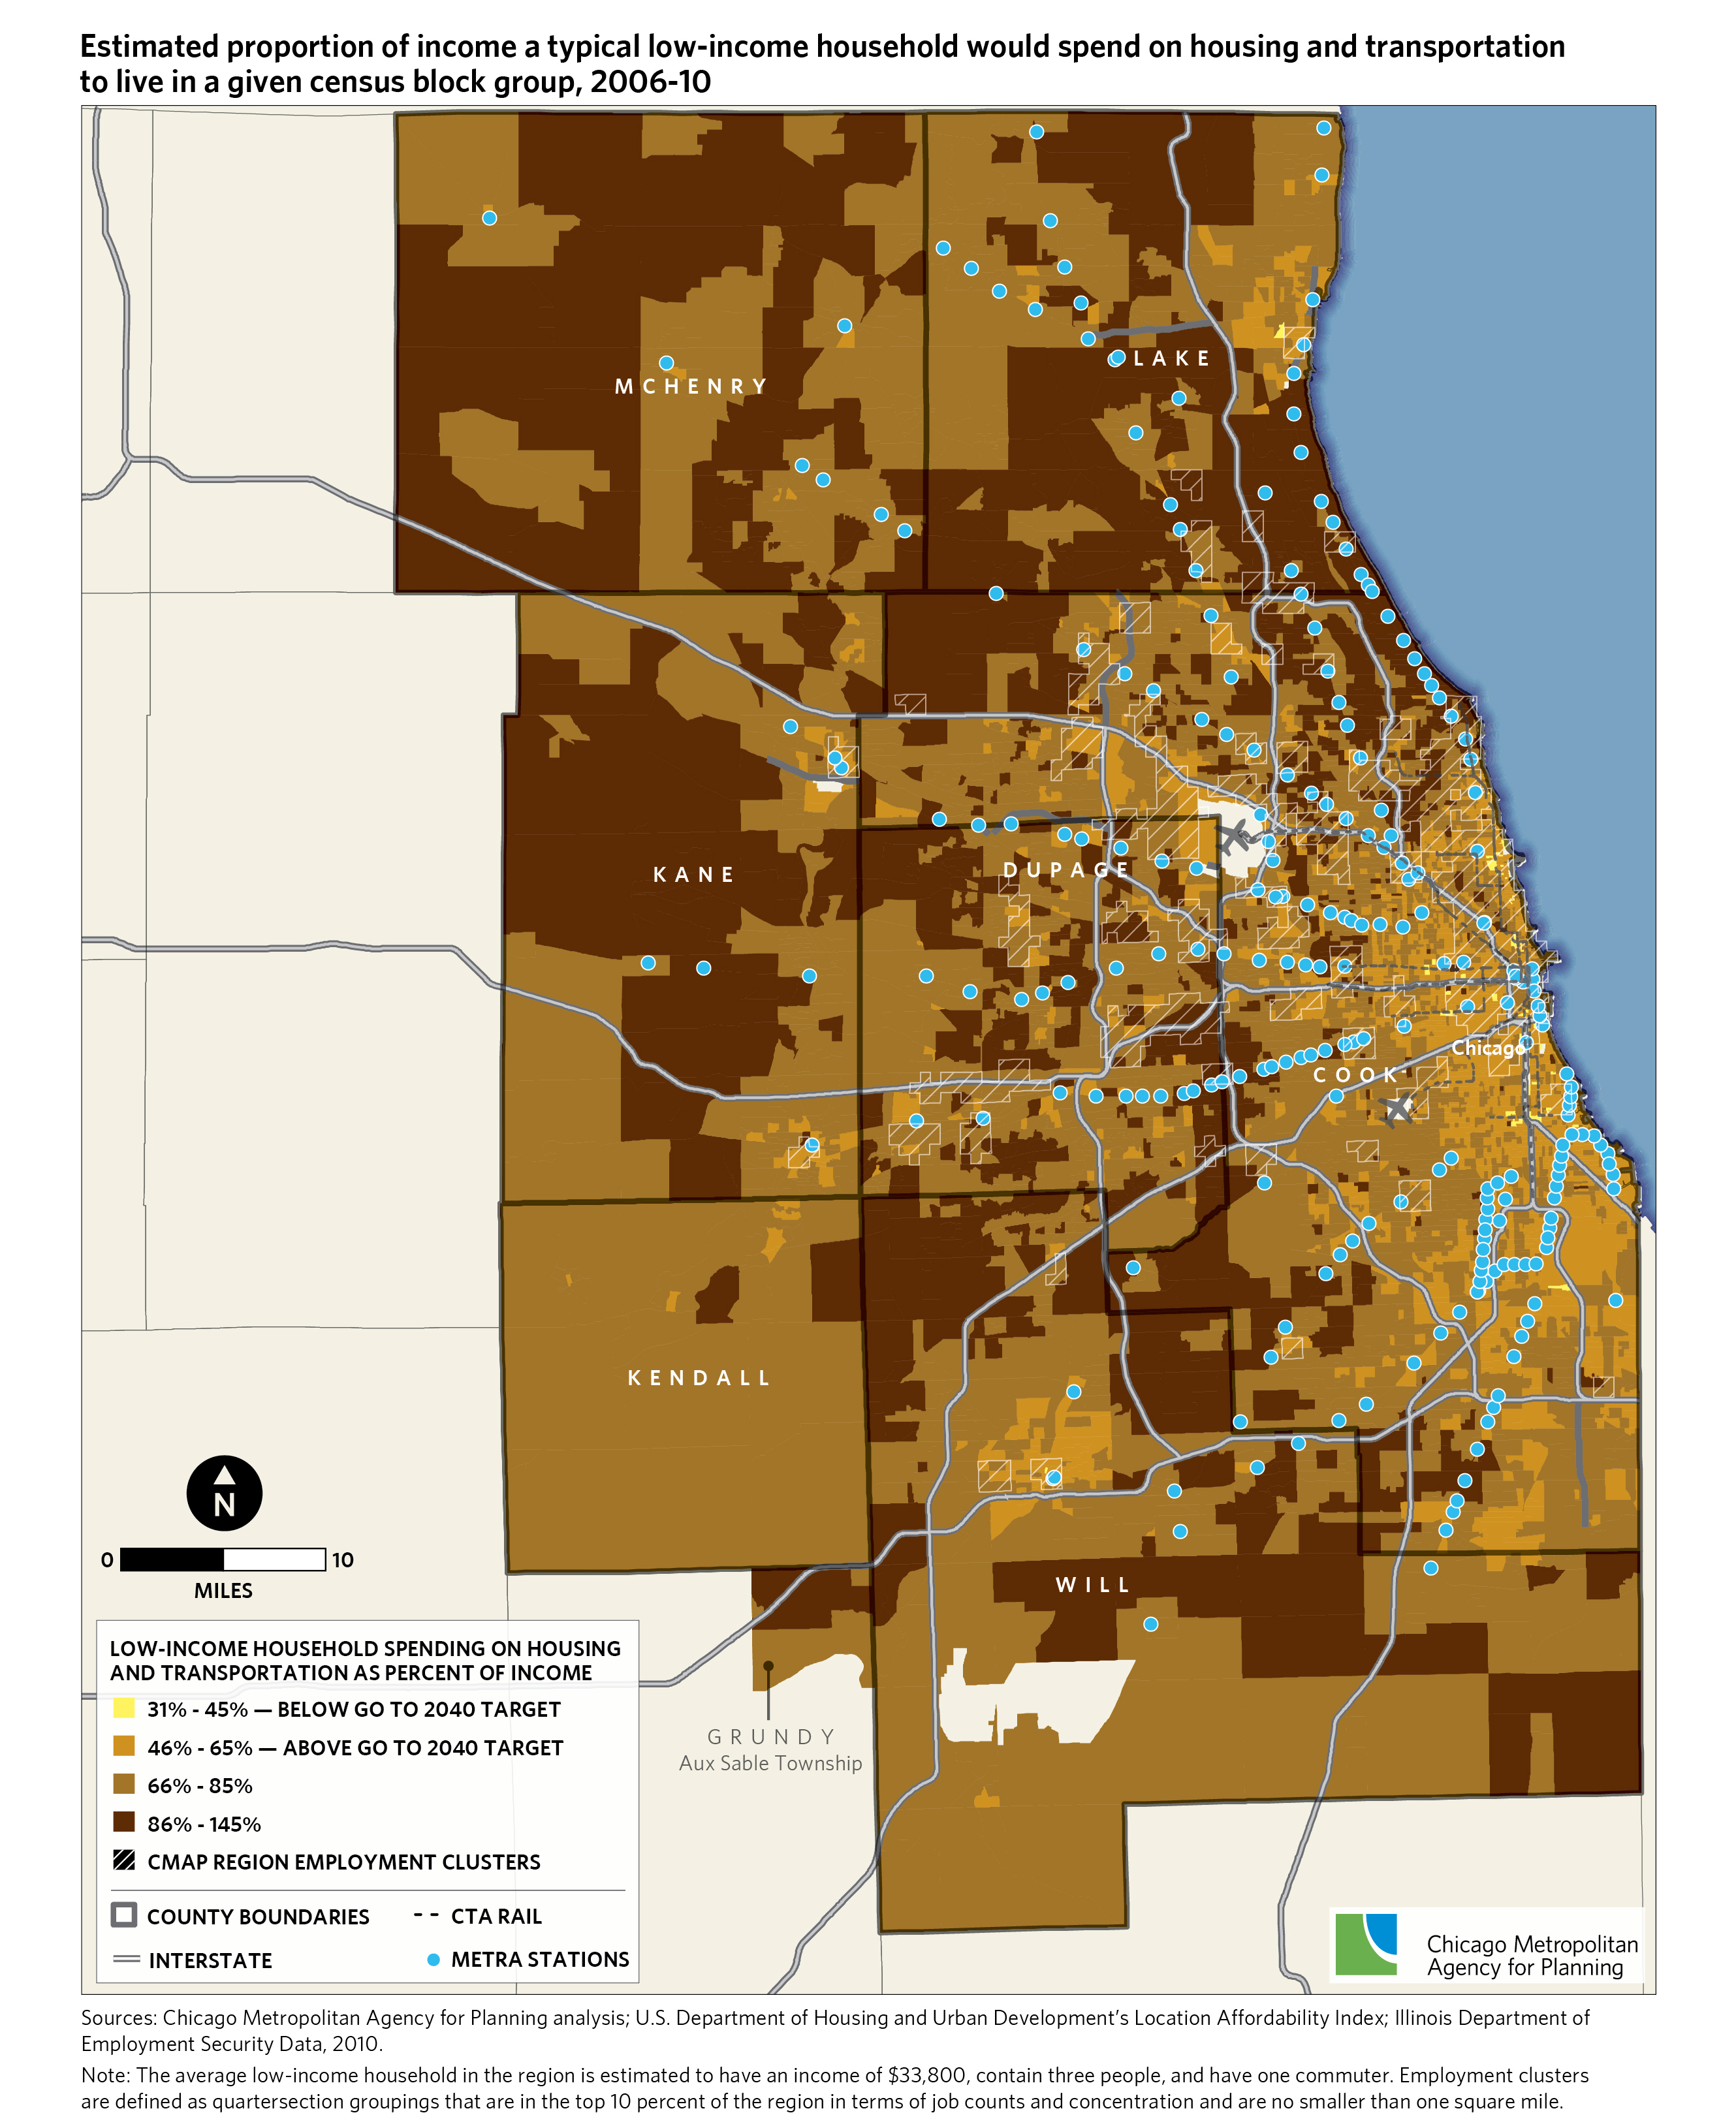
The following map indicates that low-income households must spend a substantial percentage of their income on housing and transportation to live in most areas of the region, regardless of proximity to transit or employment. Yellow census block groups in the map delineate areas where low-income households are estimated to spend 31 percent to 45 percent of their income on housing and transportation -- this is within the affordability threshold recommended by GO TO 2040. Only 1.1 percent of census block groups have housing and transportation costs affordable at this level. Instead, the LAI estimates that a typical low-income household would need to spend 46 percent to 145 percent of its income on housing and transportation to live in much of the region. As with the typical regional household, areas further from the center of the region tend to be more costly when both housing and transportation costs are considered.
In addition, the LAI estimates that housing and transportation costs within the region's employment clusters are not affordable to low-income households. Because of the higher cost of housing around major job centers, low-income households must move farther away to find affordable housing and thus face increased commute times and costs. This means fewer jobs are accessible within a 45-minute commute for many low-income residents. For example, CMAP analysis indicates that residents near the proposed CTA Red Line South Extension face long transit and auto commutes compared to the rest of the region.
GO TO 2040 and livability
The GO TO 2040 plan recommends that the region promote livable communities by reinvesting in existing communities, pursuing opportunities for more compact, walkable, and mixed-use development, and providing a range of housing options. Over the long term, this development pattern can reduce household travel costs through decreased travel times and increased transit access. The full household cost savings of creating livable communities are best understood by including transportation costs along with housing costs when determining standards of affordability.
This analysis indicates that, while the typical regional household can expect to pay an affordable percentage of its income on housing and transportation costs in many areas of the region, very few parts of the region are affordable for low-income households. In addition to the household transportation cost impacts, this dichotomy reduces the ability of low-income residents to participate in the workforce, limits the access of businesses to the region's labor pool, and reduces economic competitiveness.
Providing more housing options throughout the region is one strategy to lessen these combined costs for low- and moderate-income residents. Local governments are the primary implementers of strategies to promote housing options. To assist communities in analyzing and planning for their future housing needs, CMAP and partners offer assistance through the Homes for a Changing Region program. Counties and municipalities have many opportunities to promote housing options, such as housing preservation, land trusts, or inclusionary zoning. Communities can also pursue opportunities for denser development that mixes uses and housing types near transit services, as well as ensure that new housing near transit includes affordable housing provisions in order to maintain affordability in the long-term. Appropriate ways to address mixed-use or mixed-income development will vary by community and should be implemented in locally appropriate ways.