CMAP's regional economic indicators microsite features key measures of metropolitan Chicago's economy and, where applicable, compares these measures to peer metropolitan areas. The microsite is a resource for economic development professionals, planners, and others who seek to understand the complex factors that shape our region's competitiveness in the global economy. Indicators will be updated periodically as data become available, and CMAP Policy Updates will provide additional analysis. This Policy Update is an in-depth review of alternative measures of unemployment, supplementing the microsite's unemployment indicator.
 While the most recent economic downturn officially ended in June 2009, unemployment rates both nationwide and in metropolitan Chicago remain higher than pre-recession rates. Across the U.S., it is taking unemployed individuals an average of 32.4 weeks to find a job, which highlights the difficulty of finding employment in the post-recession economy. The slow employment recovery has spurred increased discussion about who should be classified as unemployed and how these rates should be measured.
Counting the unemployed
Estimating unemployment rates begins with determining who should be counted as part of the labor force (the total number of working and job-seeking individuals). While this may seem straightforward, a number of different classifications are based on job seekers' behaviors. The U.S. Bureau of Labor Statistics (BLS) maintains six official measures of unemployment, classified as U-1 through U-6.

U-3 is the most widely reported number, and its definition is based on standards maintained by most Organization for Economic Co-operation and Development countries and the United Nations International Labour Organization. A number of economists have recently called to attention the lesser-used BLS alternative measures of unemployment in order to shed light on the slow jobs recovery. These measures include unemployed individuals who are not traditionally counted under U-3, such as discouraged, marginally attached, and underemployed workers. Because the BLS's U-4, U-5, and U-6 measures count these workers, they produce higher unemployment estimates than the traditional U-3 rate. For example, alternative employment measure trends show that the economic downturn has led employers to eliminate jobs or reduce work hours from full-time to part-time. This trend is not apparent from looking at U-3 data alone.
Alternative measures of unemployment
The BLS's U-6 unemployment measure has taken center stage in recent discussions. As of 2013, the national U-6 rate stood at 13.8 percent -- 6.4 percentage points higher than the more widely reported U-3 measure of 7.4 percent. The 2013 Illinois U-6 rate was 16.0 percent -- 6.9 percentage points higher than the statewide U-3 rate of 9.1 percent.
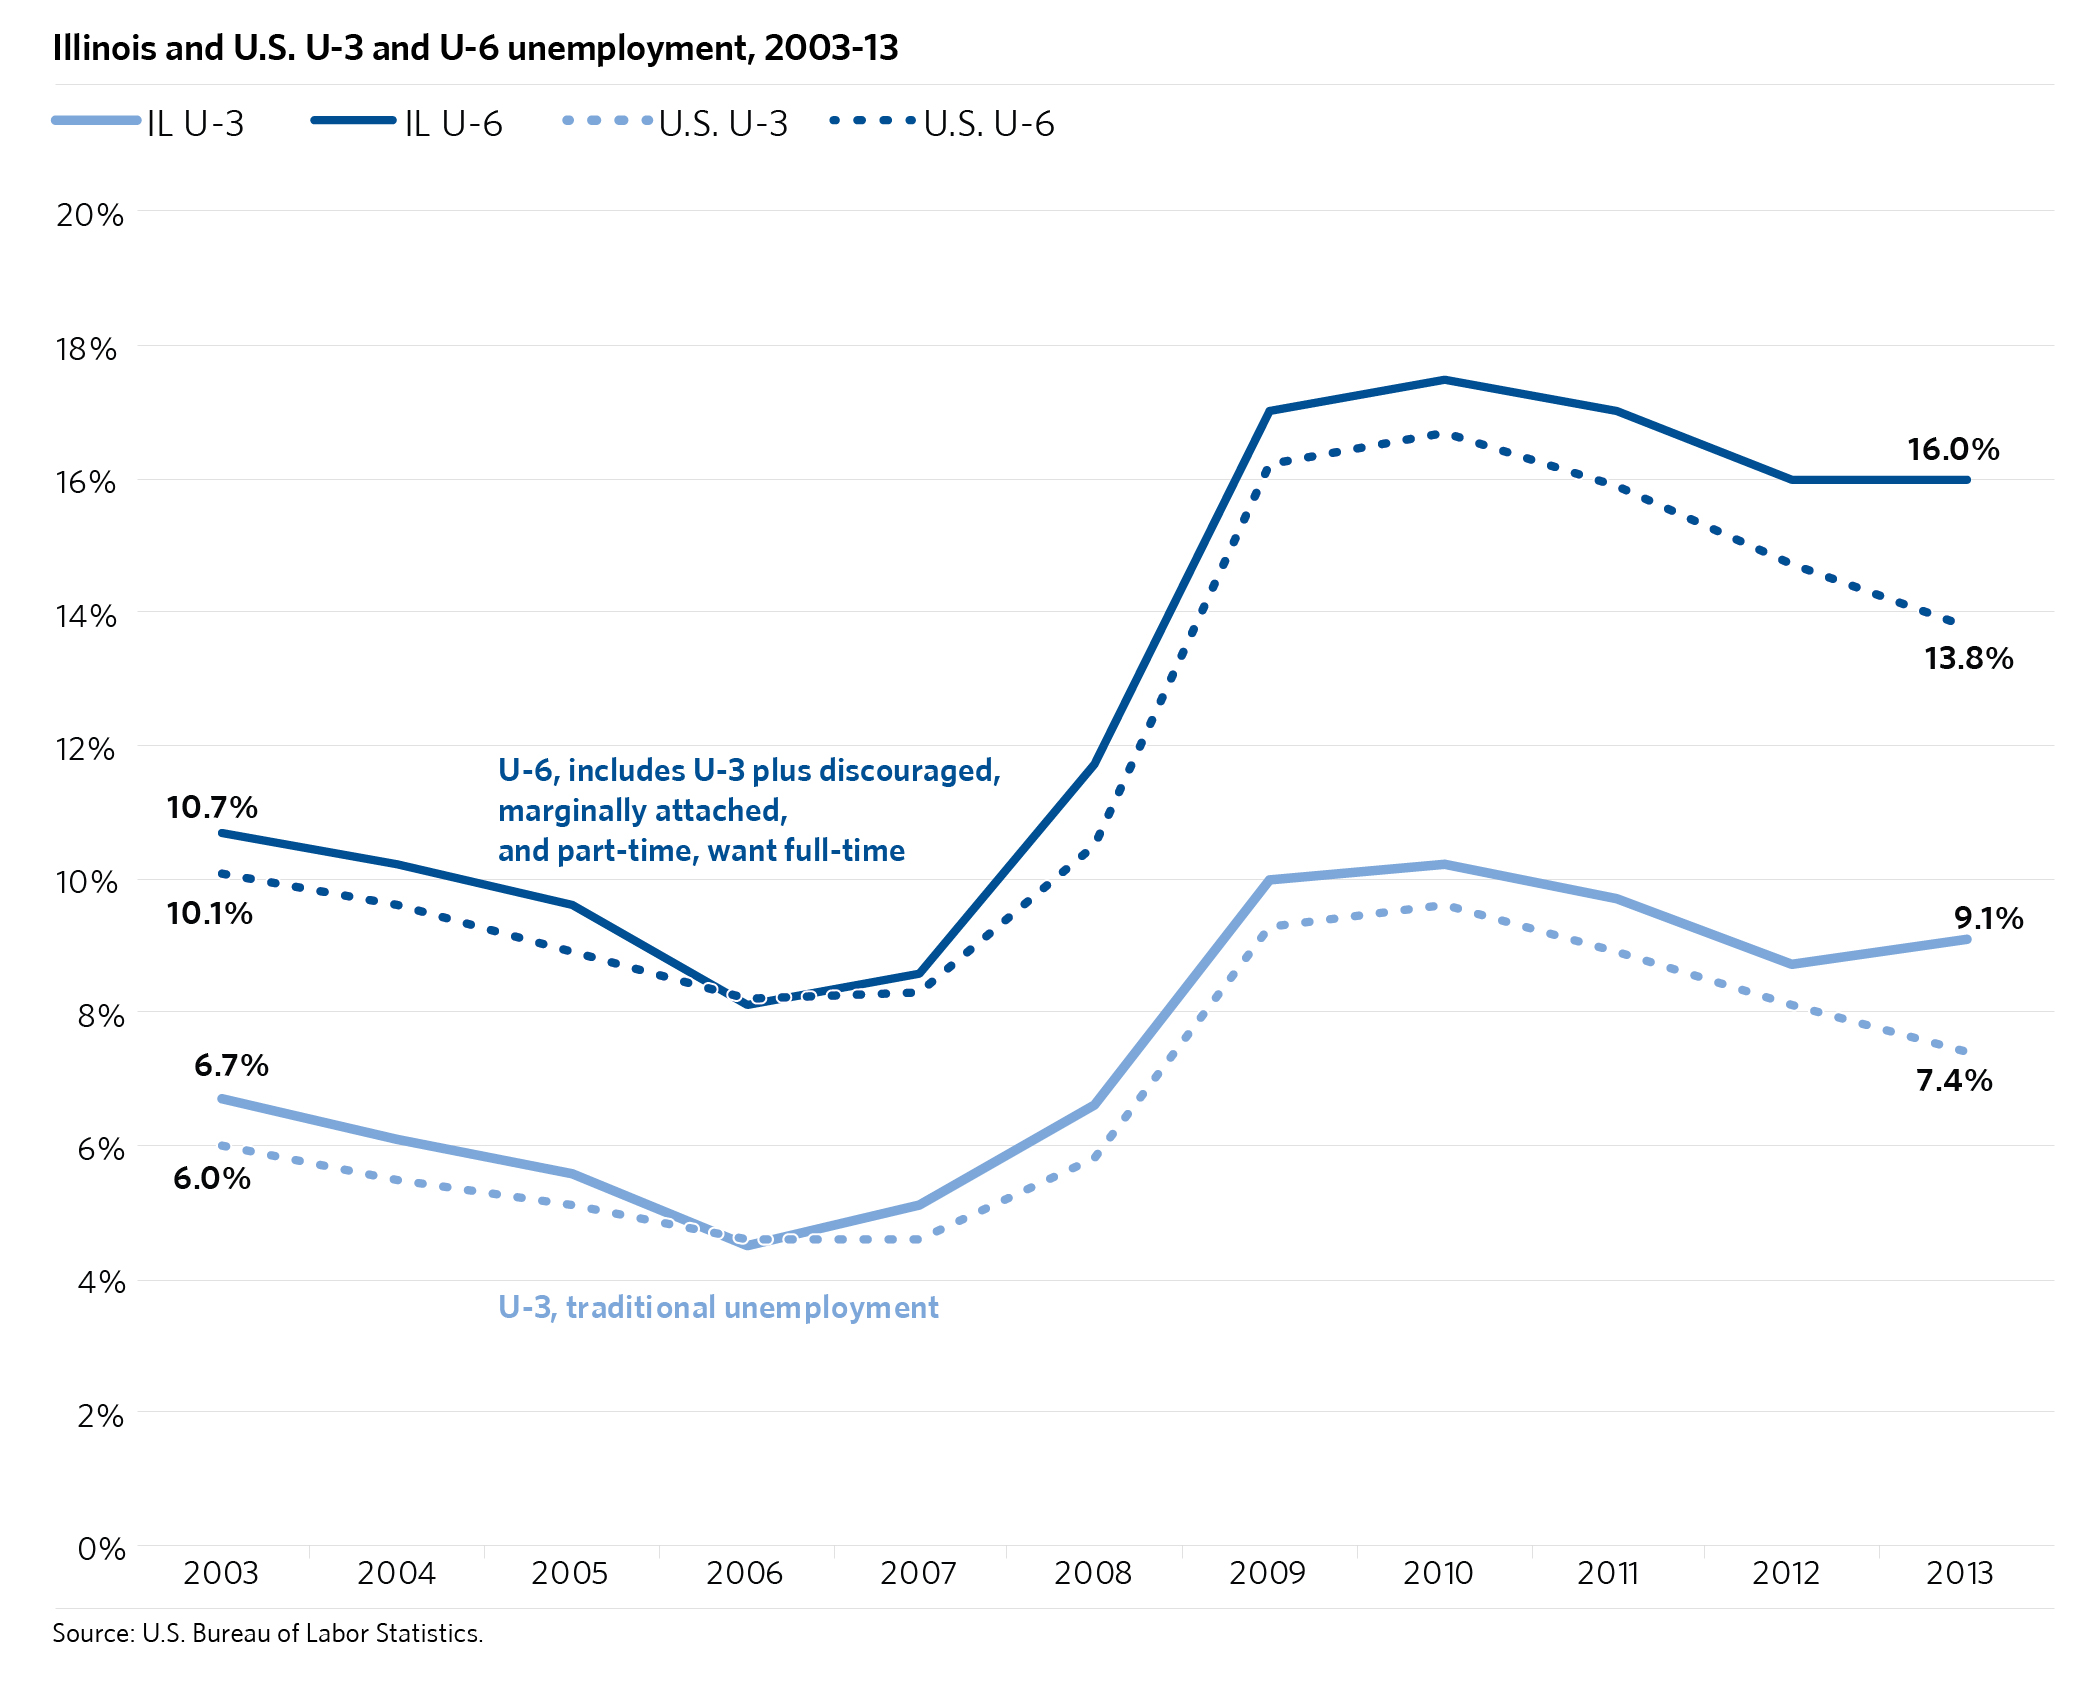
While the large gap between U-3 and U-6 unemployment rates alone is striking, trends in the data show that an increasing proportion of workers appear to be discouraged, marginally attached, or working part-time while wanting to full-time. Between 2003-07, the differential between U-6 and U-3 unemployment averaged 3.8 percentage points in Illinois and 3.9 percentage points nationally, but this gap has widened significantly since the beginning of the recession. From 2007-13, the difference in U-6 and U-3 unemployment rates has averaged 6.8 and 6.5 percentage points at the state and national levels, respectively.
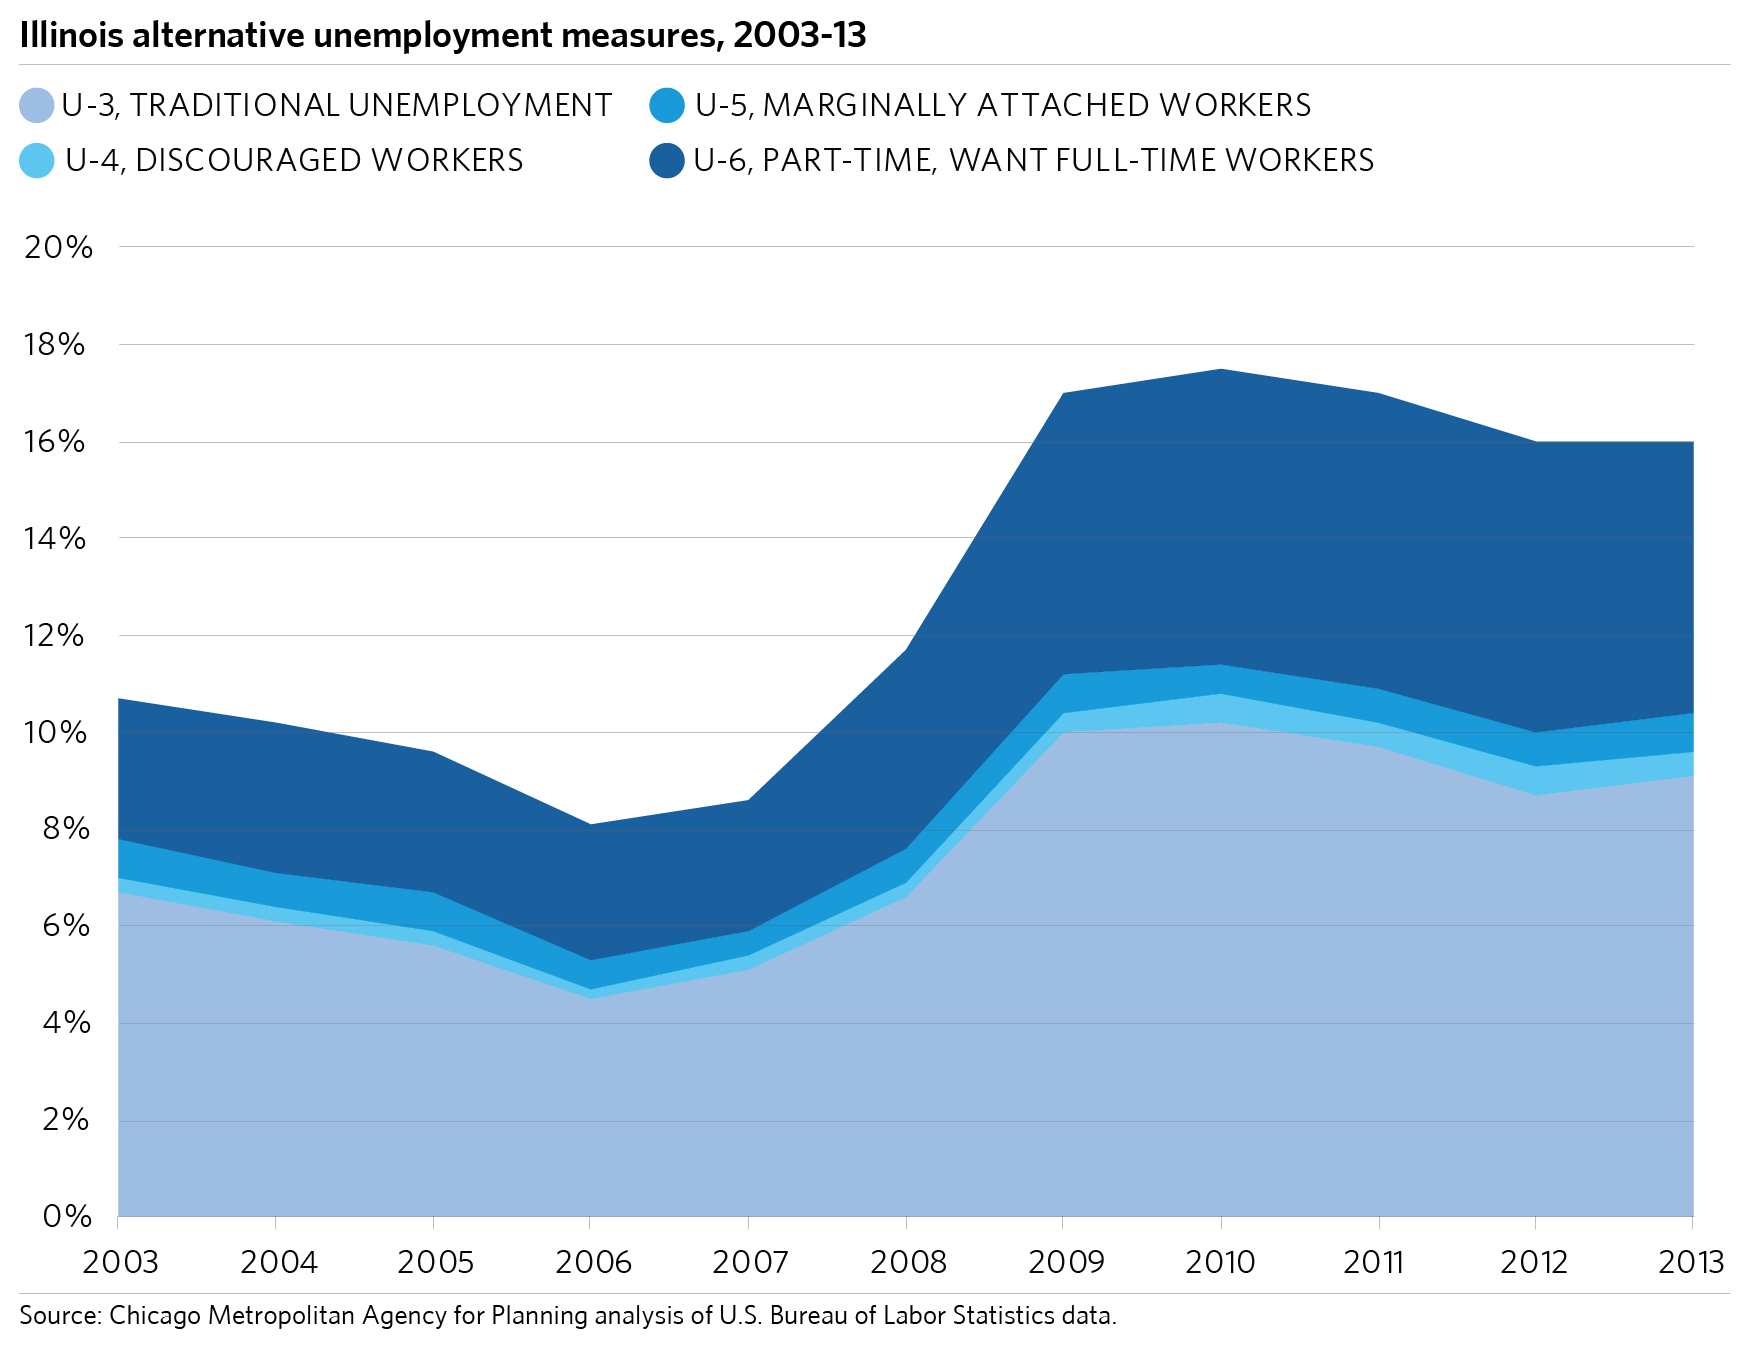
Media coverage of unemployment tends to focus on those who are out of work or discouraged, but a deeper dive into the data show that the number of individuals working part-time but wanting to work full-time has driven the increasing gap between U-6 and U-3 unemployment since the recession. The following chart shows select unemployment measures for the State of Illinois. While the number of discouraged workers increased slightly since the recession, nearly all of the U-6 growth can be attributed to an increasing number part-time employees who want to work full-time.
While the traditional U-3 measure sheds some light on labor underutilization, examining alternative measures of unemployment provides a more robust picture of national and local labor market trends. These trends show that the negative impacts of the recession are not limited only to those who have lost their jobs, but extend to a number of workers who have had their hours cut back. For some, this has meant reduced income and diminished or lost benefits. These struggles are not captured through analysis of U-3 data alone. Furthermore, the presence of a large pool of part-time workers suggests that, while the economy may be recovering, labor markets are not being tapped to their full potential.
Unemployment is a complex indicator, and there is little agreement as to which of the six measures most adequately portrays the current state of the labor market. By examining multiple unemployment measures, it is possible to more accurately portray the state of the economy.