On December 3, 2015, the U.S. Census Bureau released its 2010-2014 American Community Survey (ACS) 5-year estimates. The ACS collects information such as ancestry, educational attainment, income, employment, and housing characteristics and makes this data available at multiple geographic levels, including municipality and township. This release of the ACS marks the first time that users and analysts are able to compare two non-overlapping 5-year ACS datasets (2005-2009 and 2010-2014), and the first time that many of the region's smaller communities will be able to see this change for their jurisdictions. This Policy Update is part of a series that uses the most recent ACS data to examine broad trends in the CMAP region.
This Policy Update analyzes trends in the racial and ethnic composition of the CMAP region's population. Understanding broad demographic trends can provide insight into land use, housing, transportation, economic development, and other issues that communities must consider in their plans. Previous CMAP analysis indicates that the region's population has increased slowly over the last decade, and that the Hispanic or Latino population has been increasing more rapidly than population in the region as a whole. The 2010-2014 American Community Survey estimates indicate that the CMAP region is increasingly diverse, with growth driven by persons of color (POC), primarily the Hispanic or Latino populations and the Asian, Native Hawaiian, and Other Pacific Islander populations. In this text, 2009 and 2014 refer to data from the 2005-2009 and 2010-2014 5-year ACS estimates, respectively.
Growing diversity in the CMAP region
The 2010-2014 ACS estimates indicate that the CMAP region's population continues the diversification trends seen from 2000 to 2010. Between 2000 and 2010, the U.S. Decennial censuses indicate that both the number of white and Black or African American residents declined by almost 4 and 5 percent, respectively. During the same period, the number of Hispanic or Latino residents increased by almost 30 percent, and the number of Asians, Native Hawaiians, and other Pacific Islanders grew by over 36 percent.
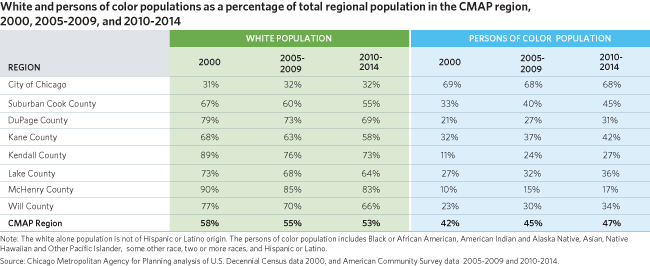
These changes in population are leading to shifts in the overall racial and ethnic composition of the region. White residents remain the largest population group in the region, although their share of the total population decreased between 2000 and 2009 and again between 2009 and 2014. The white population made up just over half of the region's residents in 2014. But, the region's second-largest population group has shifted since 2000. In 2000, the Black or African American residents were the second largest population group. According to the 2005-2009 estimates, this population group decreased while the Hispanic or Latino population increased, and the Hispanic or Latino population became the second largest racial and ethnic group in the CMAP region. The most recent 5-year ACS estimates indicate that the share of the Hispanic or Latino population has continued to increase, growing by 2 percentage points between 2009 and 2014.

Demographic shifts by geography
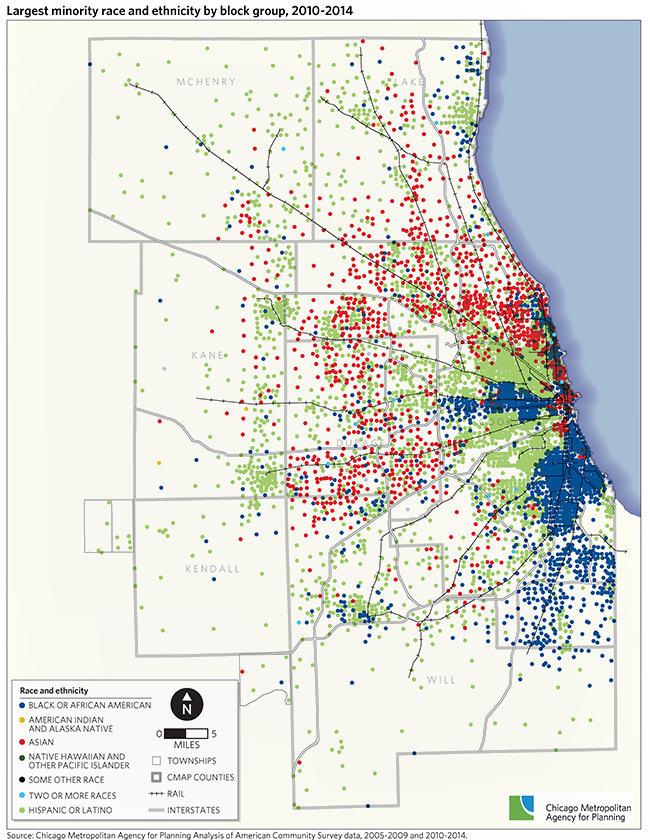
While the region as a whole is becoming more diverse, the racial and ethnic changes differ across the region, with distinct spatial concentrations. These concentrations and the ways that they are changing can have important implications for local and regional planning efforts. The map below highlights the largest POC group by block group and indicates that varying race and ethnicity groups have different location patterns in the region. In particular, both domestic and international migration patterns have led to increasing diversification of the region's suburban areas.
While the region as a whole has become more diverse over time, different areas experienced varying population changes. As seen in the table below, the share of white and POC population remained unchanged in the City of Chicago between 2009 and 2014. In Suburban Cook, DuPage, and Lake Counties, the racial composition became increasingly diverse, with the percentage of the POC population increasing its share of the total regional population by 5 to 7 percentage points between 2000 and 2009. This trend continued in 2014, with diversification of the region's racial and ethnic composition continuing to increase. The racial composition of the collar counties, Kane, Kendall, McHenry, and Will, also became increasingly diverse during this time period. The percentage of POC residents more than doubled between 2000 and 2009 in Kendall County, and it increased by 5 to 7 percentage points in the remaining three counties. Between 2009 and 2014, the POC population continued to grow its share of the population in these four counties. Much of this diversification is driven by changes in the Hispanic or Latino population.
Growth of the Hispanic or Latino population
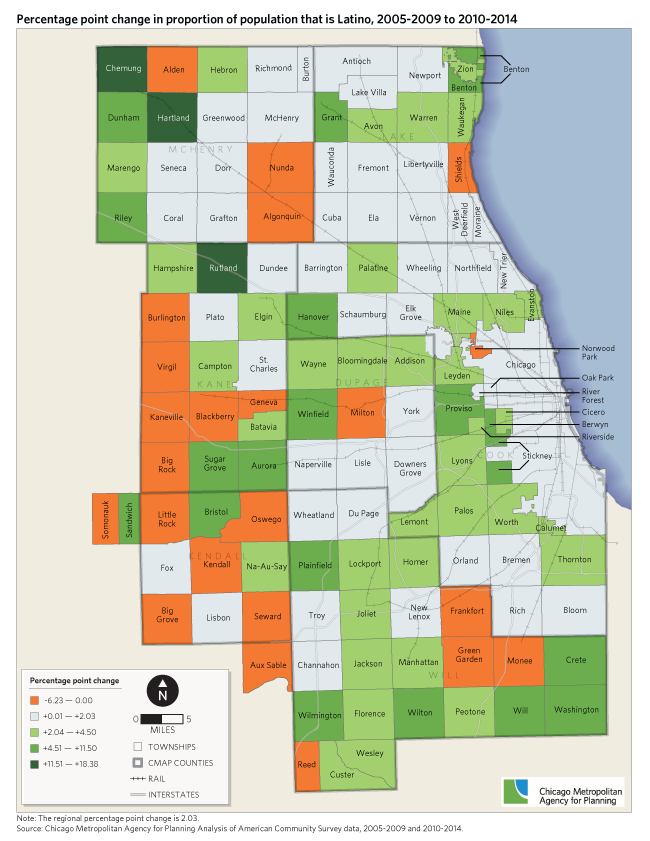
According to 2010-2014 ACS estimates, the Hispanic or Latino population now makes up the second largest population group in the region. Between 2000 and 2014, the largest such population growth has occurred in suburban areas, with the largest percentage point increases occurring in suburban Cook County as well as parts of Lake, Will, and Kendall counties. The edges of the CMAP region experienced both the largest decreases as well as the largest increases in the proportion of the population that is Hispanic or Latino. The map below illustrates change by township.
Looking ahead
To a significant degree, recent population growth in the region has been driven by POC residents. Whether they are recent immigrants or were born to households who have been in the U.S. for multiple generations, these new residents contribute to our region's economy and cultural richness. GO TO 2040 anticipates that metropolitan Chicago will continue to experience significant demographic changes in part due to rapid growth in the region's Latino population. These shifting demographics have many implications for regional and local planning. Racial and ethnic population groups may hold varying preferences and face different challenges in housing, transportation, education, employment opportunities, and other factors that impact quality of life. CMAP resources such as the Immigrant Integration Toolkit and the Homes for a Changing Region program can assist municipalities in addressing the needs of their changing demographics and improve economic development, enhance civic participation, create a culture of inclusiveness, and provide access to the health, housing, and economic opportunities for all populations. As a part of developing the next long-range plan, CMAP will be releasing a demographics snapshot analyzing changes in the region's demography, so stay tuned for more updates.