The U.S. Census Bureau recently released Housing Characteristics: 2010, a brief discussing change in housing unit counts, vacancy rates, and homeownership in the US. The press release notes that homeownership rates have declined over the last decade but are still at their second-highest rate since the bureau began collecting data in 1890. At the same time, vacancy rates have increased in the Chicago region and across the nation. The homeownership rate is affected by various factors. The rate is calculated using only occupied housing units and therefore can shift due to changes in both overall housing stock and housing vacancy rates. A decline in the homeownership rate may mean that a community has added more renter-occupied housing than owner-occupied housing, or it may mean that vacancy rates in owner-occupied units have increased faster than vacancy rates in rental housing.
Changes in vacancy and homeownership rates often occur together and can have significant impacts on communities. Sharp increases in vacant housing stock can impose significant cost burdens on municipalities, and changes in the balance between renter and owner-occupied housing may also lead to tensions within a community. However, increased vacancy and/or decreased homeownership rates may also provide opportunities for communities. GO TO 2040 emphasizes reinvesting in communities with existing infrastructure to accommodate future growth and estimates that there are 75,000 acres of underutilized residential land in the region that can be redeveloped. Underutilized residential sites can also offer an opportunity for communities to provide a broader range of housing options, particularly for the region's growing senior population, some of whom may wish to "age in place."
In contrast to nationwide trends, the homeownership rate in the CMAP region has increased since 2000, although change across the region has been uneven. The tables below summarize homeownership rates and the overall change in owner-occupied, renter-occupied, and vacant housing units by county and the City of Chicago. Total owner-occupied housing units increased in all areas of the region except suburban Cook County, but homeownership rates declined in suburban Cook and in DuPage, Lake, and McHenry. These areas account for 51 percent of the total housing stock in the region.

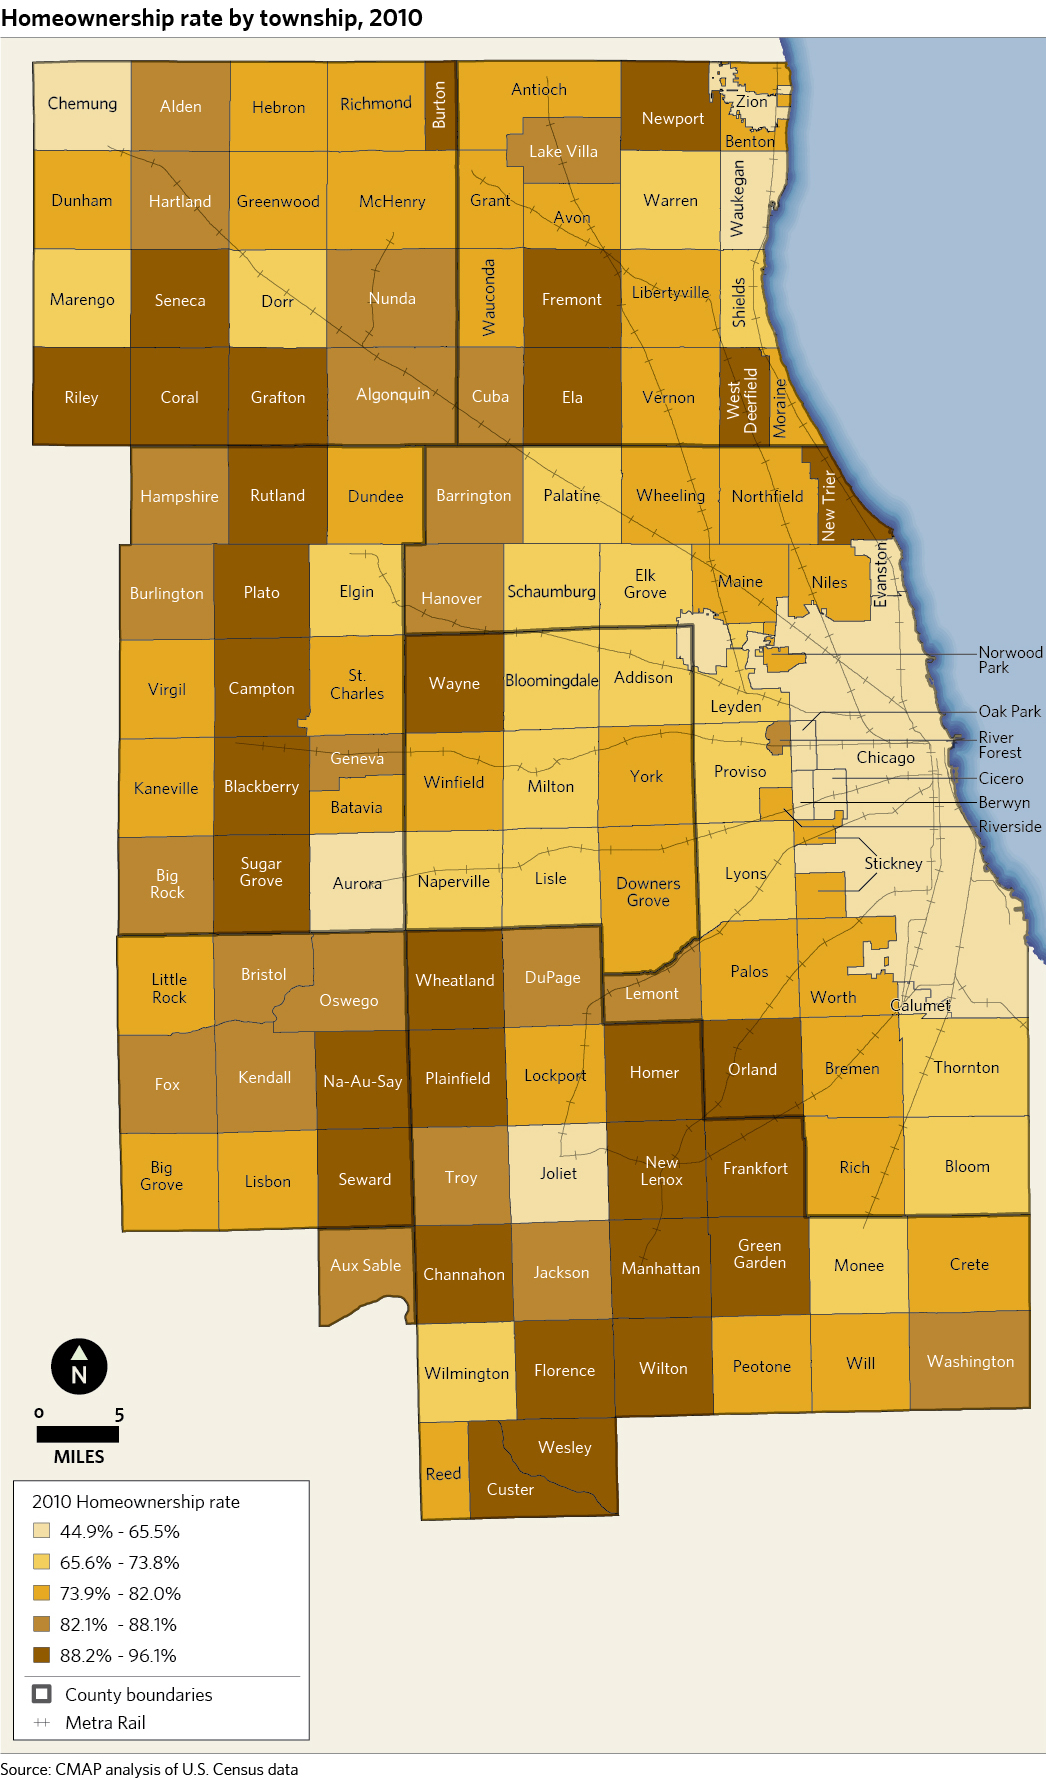
The map below depicts the 2010 homeownership rate by township in the CMAP region. Townships in the lightest yellow have a rate lower than the regional average of 65.5 percent. These lower rates occurred in Chicago and its near-west townships, as well as in Joliet, Aurora, Waukegan, and Zion townships -- townships that generally contain older, established communities with a significant supply of rental housing.
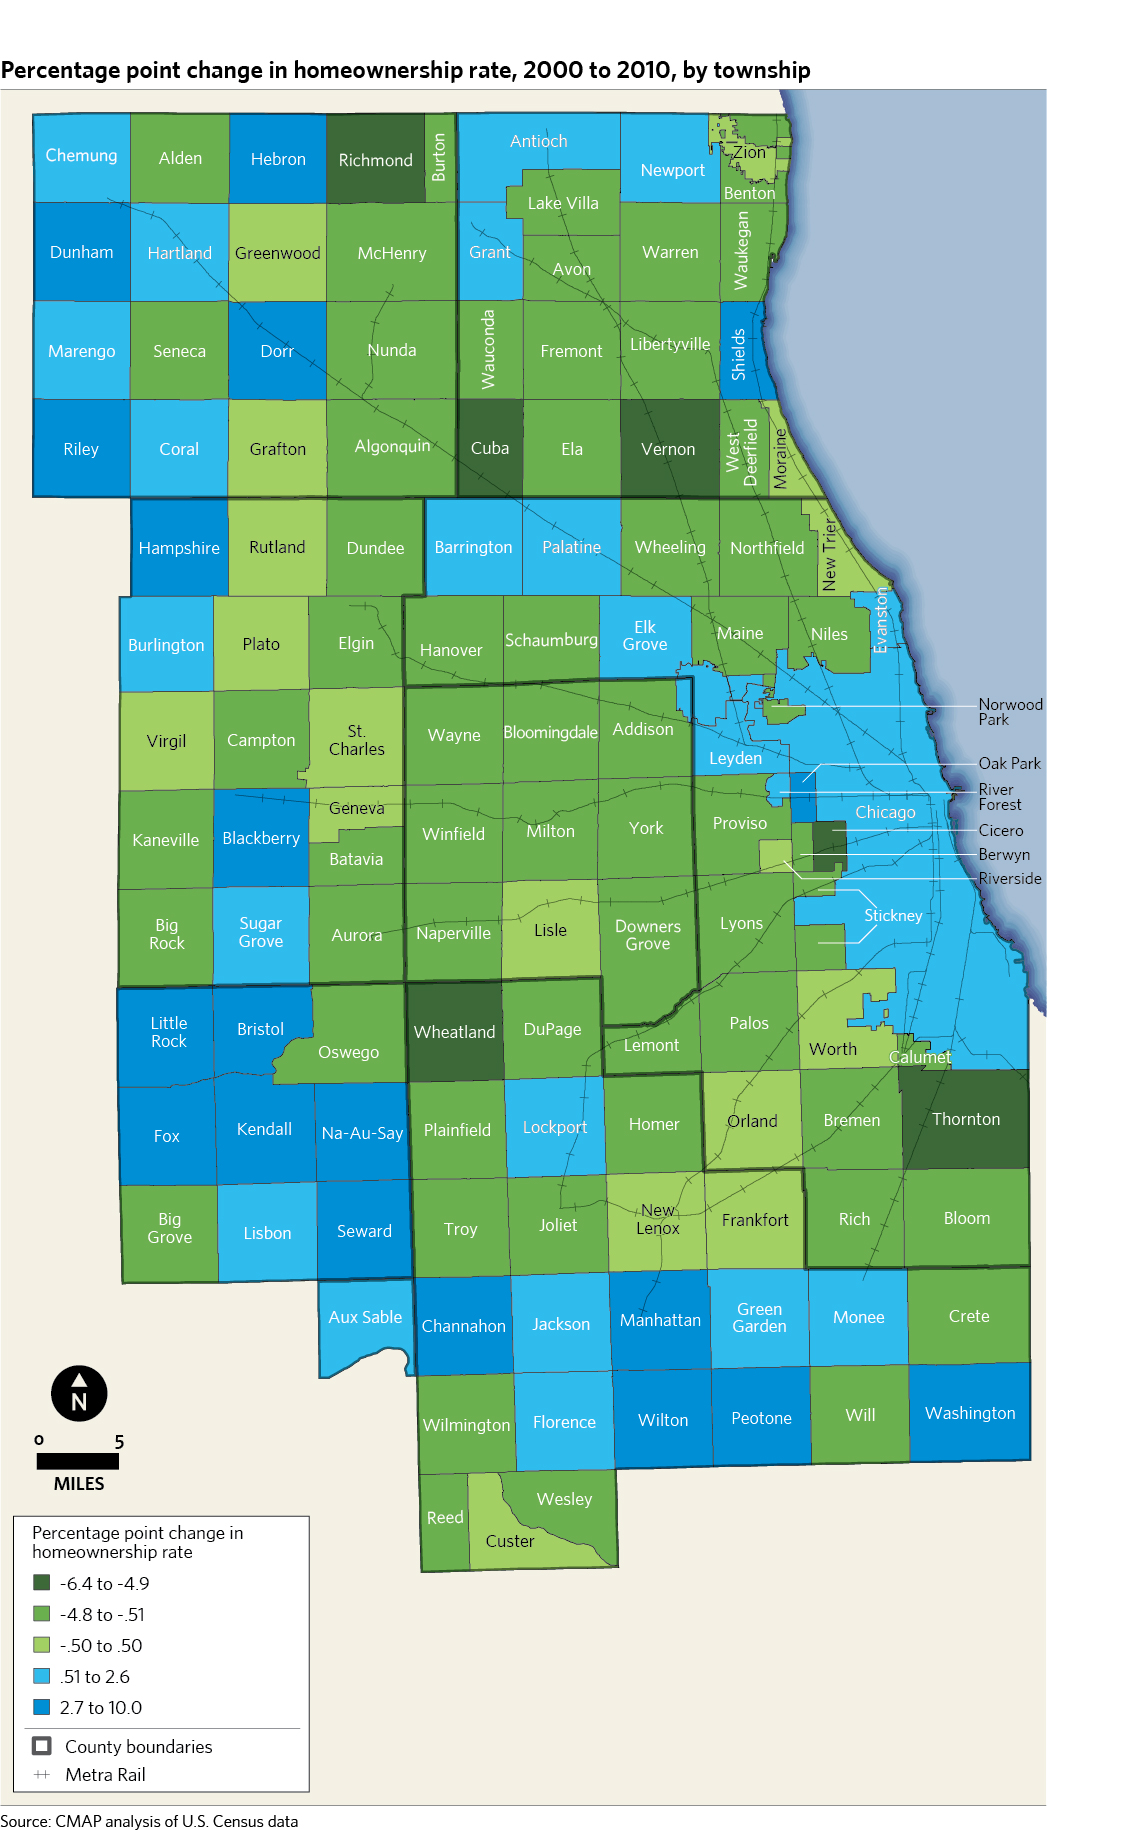
The map below depicts the percentage point change in homeownership rate between 2000 and 2010 by township in the CMAP region. Townships in light green experienced minimal change in homeownership rates, while dark blue and dark green reflect the largest changes in homeownership rates. The City of Chicago, as well as many of the outer ring and near-northwest suburbs, saw increased homeownership rates over the last decade, while inner-ring and western suburbs generally experienced a decline in homeownership rates.
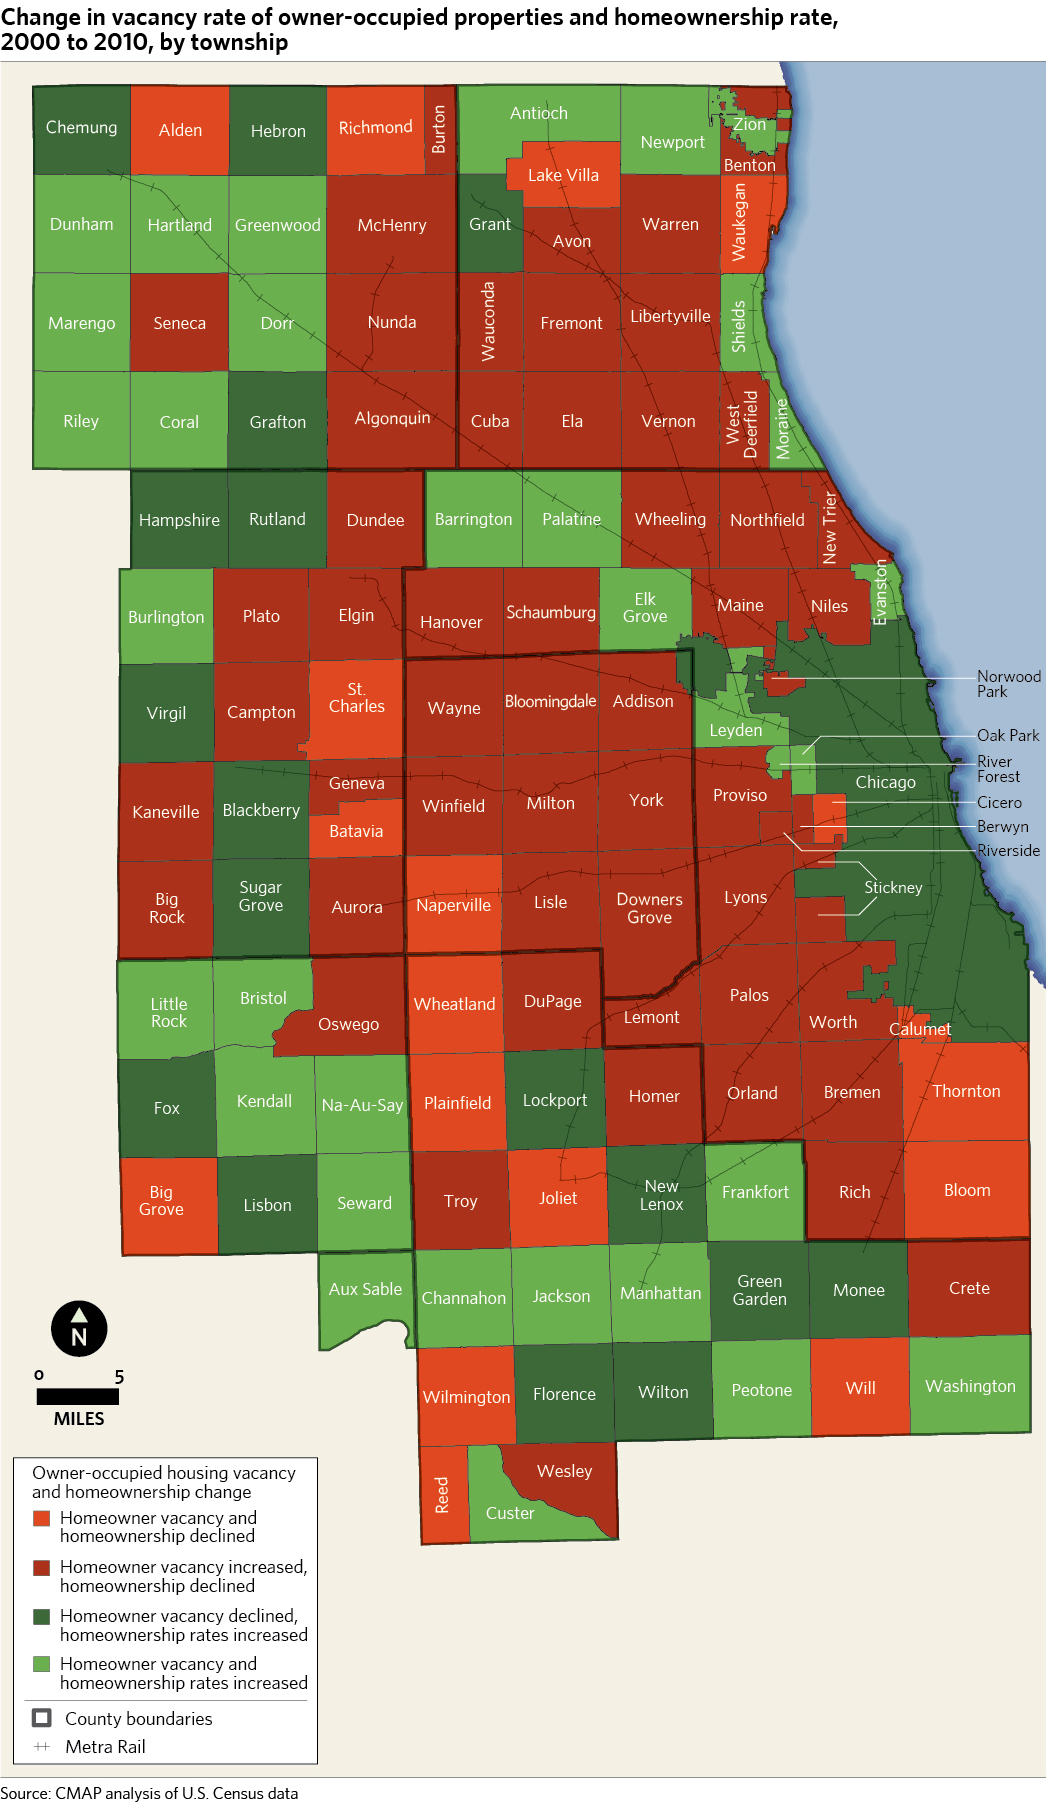
As shown in the map above, homeownership rates fell at a moderate rate throughout the inner and middle-tier suburbs. As noted in our recent Policy Update on trends in vacancy rates, these communities also experienced modest percentage point increases in vacancy rates over the last decade. The map below overlays changes in homeownership rates and owner-occupied housing vacancy rates by township in the Chicago region. Approximately 76 percent of townships with a decline in homeownership rates also experienced an increase in their owner-occupied vacancy rate. As described above, an increase in vacancy in owner-occupied housing units can contribute to a decline in homeownership rates.