Indicators
Percent of Trips to Work via Non-SOV Modes
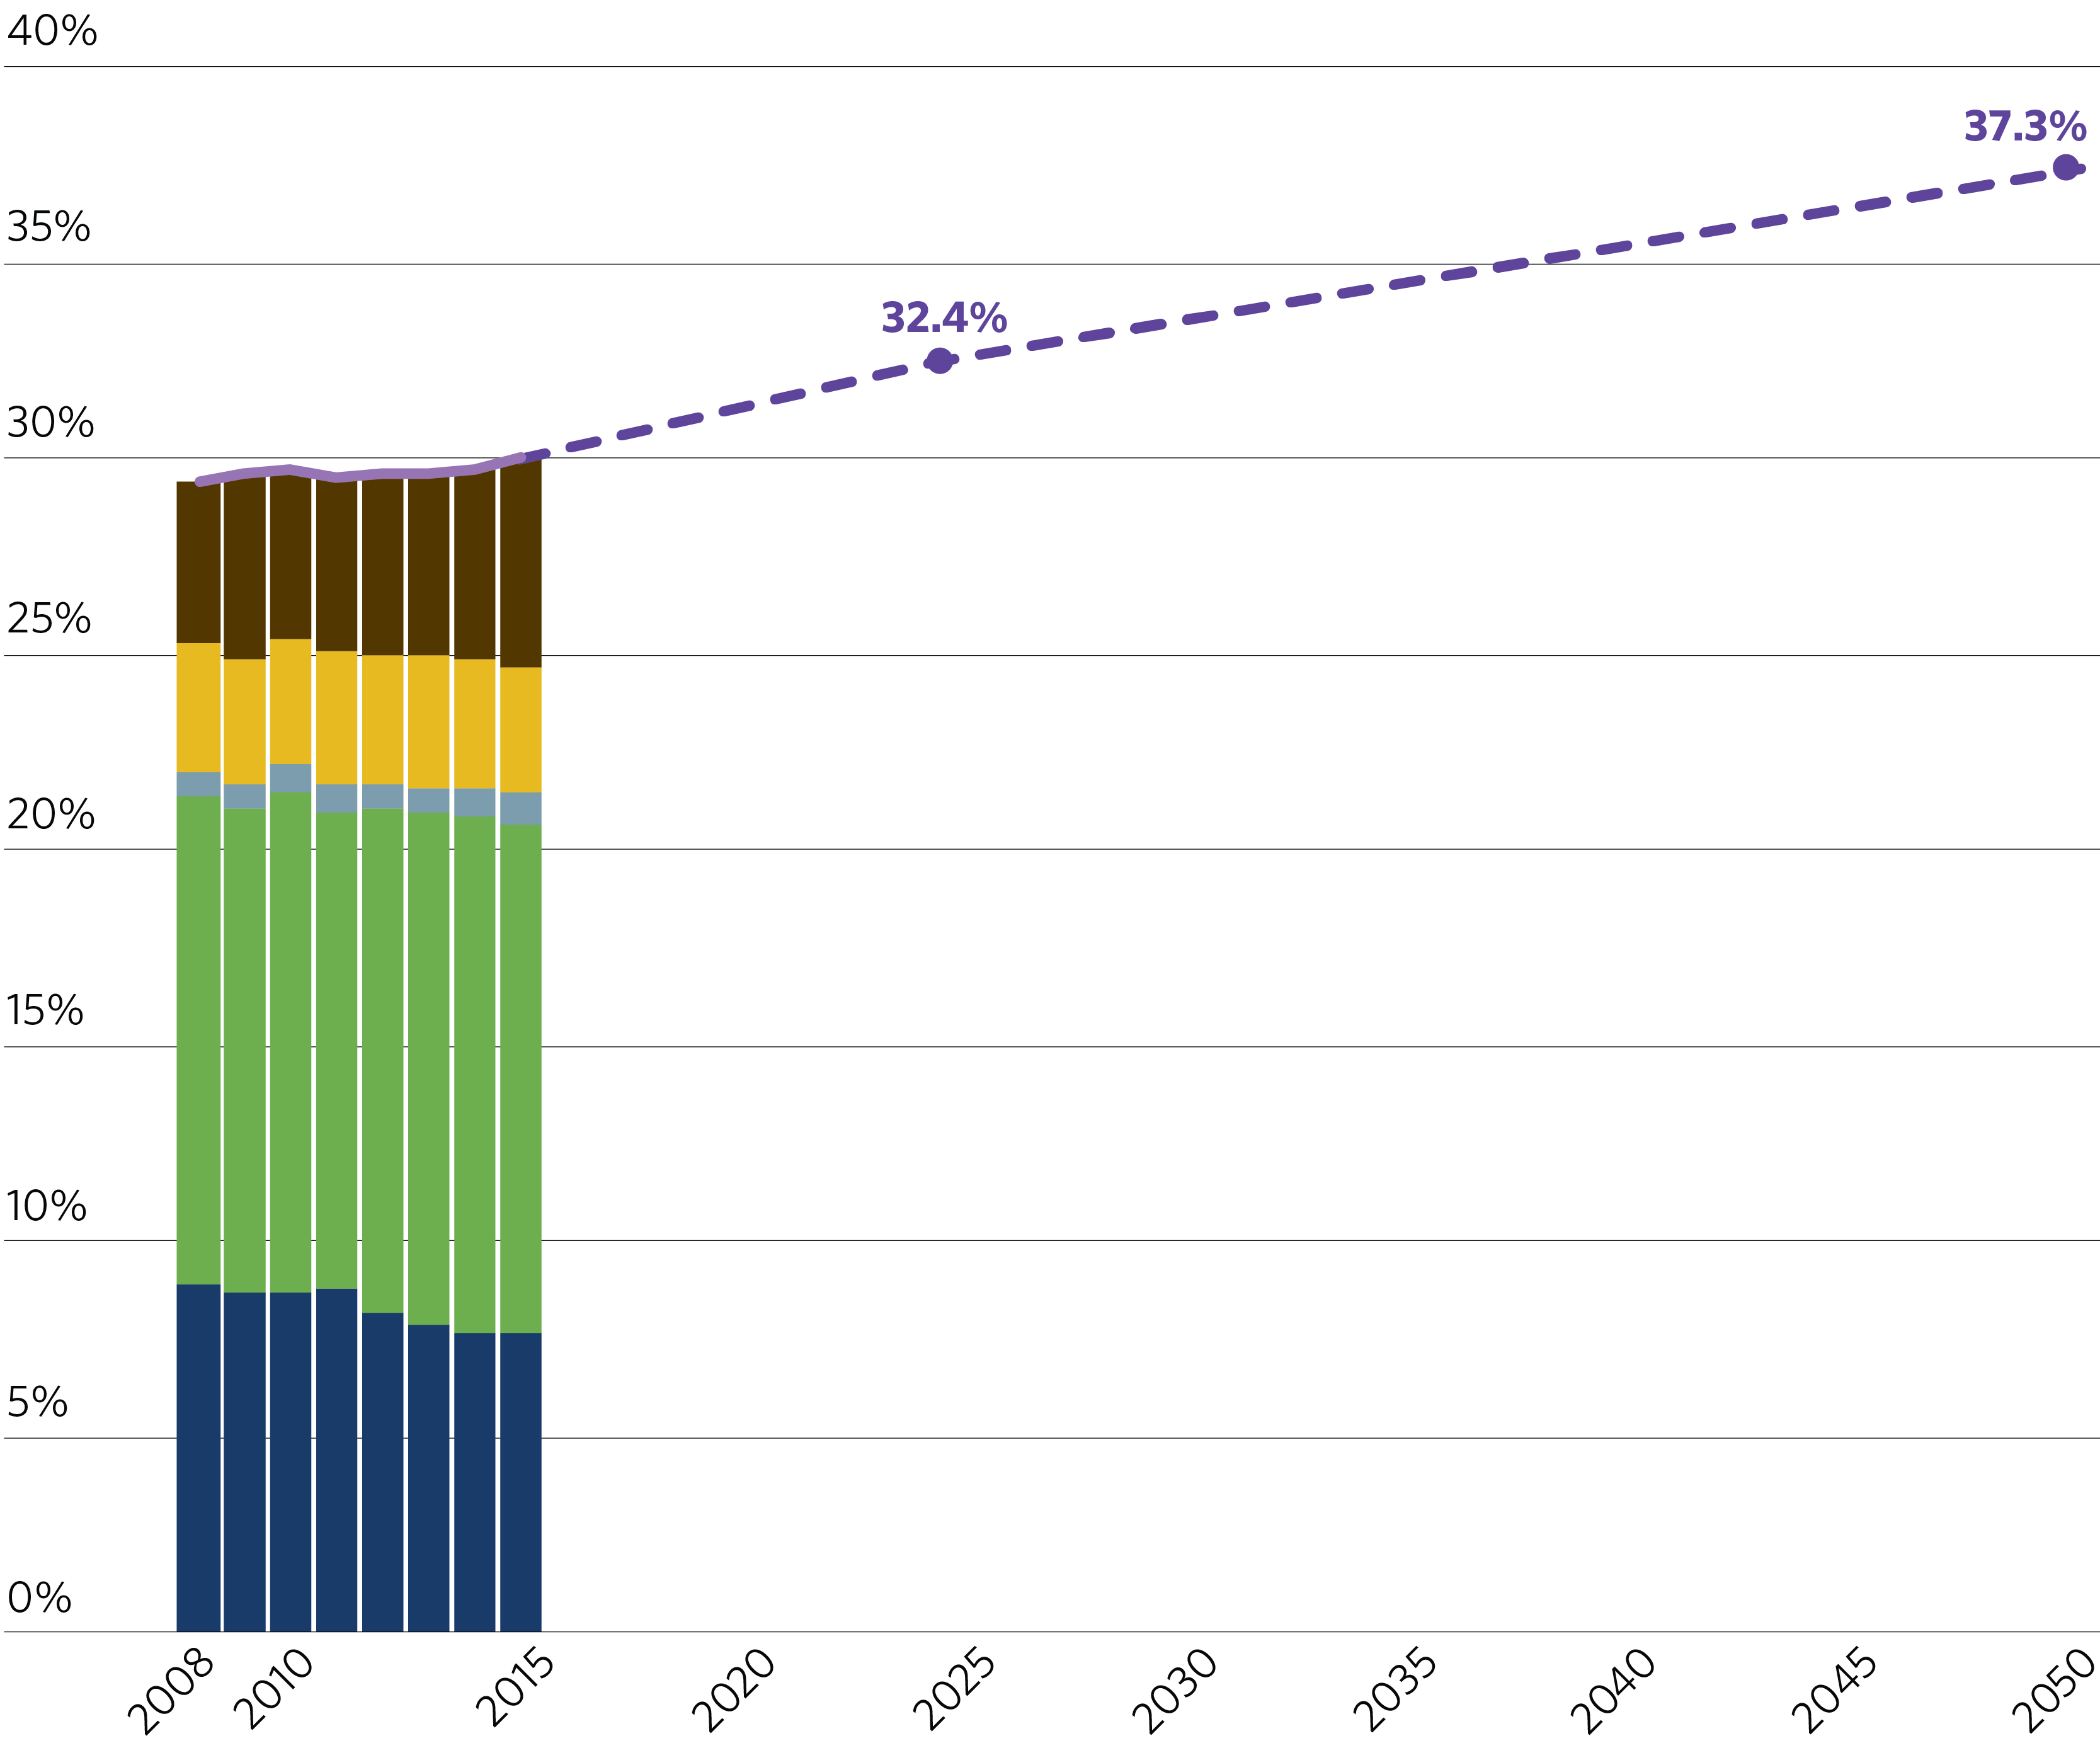
Encouraging multimodal travel makes the best use of the system, reduces greenhouse gas emissions, and improves quality of life. This measure tracks the share of trips to work by non-single occupancy vehicle (non-SOV) modes for trips to work. These modes include carpool, public transportation, walking, bicycling and telecommuting. Higher levels of non-SOV travel would yield numerous benefits: reduced congestion, better air quality, and healthier residents, to name a few. This measure is similar to the MAP-21 performance measure for non-SOV travel, but uses slightly different geography and Census data.
Targets
Recent data indicate that non-SOV travel is increasing in the region. Recent increases in non-SOV travel have been driven largely by an increase in people working at home. Implementation of policies to support transit, cycling, and walkability will enable this trend to continue.
A 2050 target of 37.3 percent is consistent with the target of doubling transit ridership (see Annual Unlinked Transit Trips). The 2025 target is based on a straight-line interpolation between 2016 ACS data and the 2050 target.
2025: 32.4 percent or more trips to work via non-SOV modes
2050: 37.3 percent or more trips to work via non-SOV modes
Sections
- Actual
- Target
- Work at home
- Walk
- Bicycle
- Public transportation
- Carpool
