Indicator
Transit Asset State of Good Repair
Maintaining the existing transportation network and improving state of good repair are substantive priorities of ON TO 2050. In particular, recent investment in the transit system has been insufficient to keep system condition from declining.
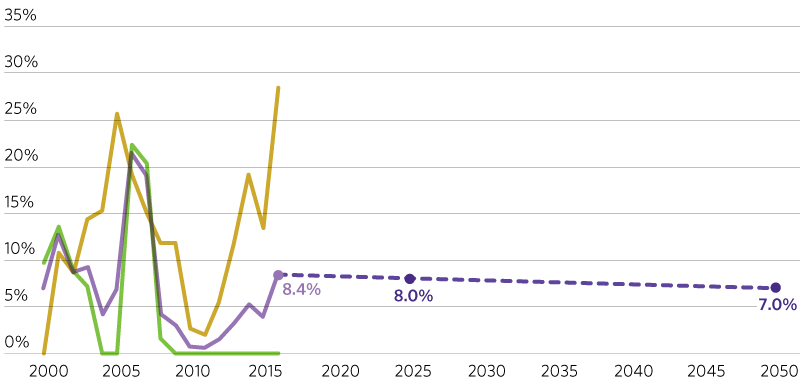
Percent of fixed-route buses that have met or exceeded their useful life
This measures the percent of active revenue public transit buses that have exceeded their useful life. This represents the number of vehicles that have reached an age where maintenance cost and vehicle performance issues are likely to increase. This measure is also a federally required performance measure under MAP-21.
Targets
State, federal, and transit agency capital programs can result in large purchases of new vehicles, which then reach their ULB at the same time. By 2025, 78 percent of Pace’s and 72 percent of CTA’s current bus fleet will have reached their ULB. As of 2016, 8.4 percent of buses have exceeded their useful life. Financial projections for ON TO 2050 include funding being directed toward reducing the state of good repair backlog. This would result in a modest improvement in bus condition to 6.4 percent of buses beyond their useful life in 2050.
2025: 8.0 percent or fewer buses exceed their useful life benchmark
2050: 7.0 percent or fewer buses exceed their useful life benchmark
Sections
- CTA
- PACE
- Combined
- Target
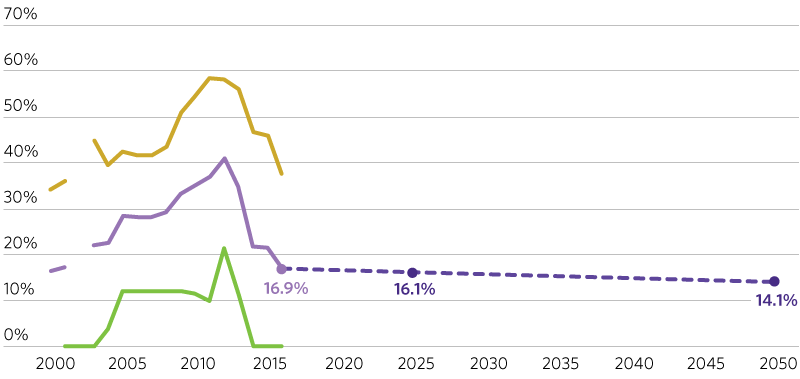
Percent of rail vehicles that have met or exceeded their useful life
This measures the percent of active revenue public transit rail vehicles that have exceeded their useful life. This represents the number of vehicles that have reached an age where maintenance cost and vehicle performance issues are likely to increase. This measure is also a federally required performance measure under MAP-21.
Targets
State, federal, and transit agency capital programs can result in large purchases of new vehicles, which then reach their ULB at the same time. Currently 16.9 percent of rail vehicles are beyond their ULB. Financial projections for ON TO 2050 include funding being directed toward reducing the state of good repair backlog. These targets are consistent with that plan.
2025: 16.1 percent or fewer rail vehicles exceed their useful life benchmark
2050: 14.1 percent or fewer rail vehicles exceed their useful life benchmark
- CTA
- Metra
- Combined
- Target
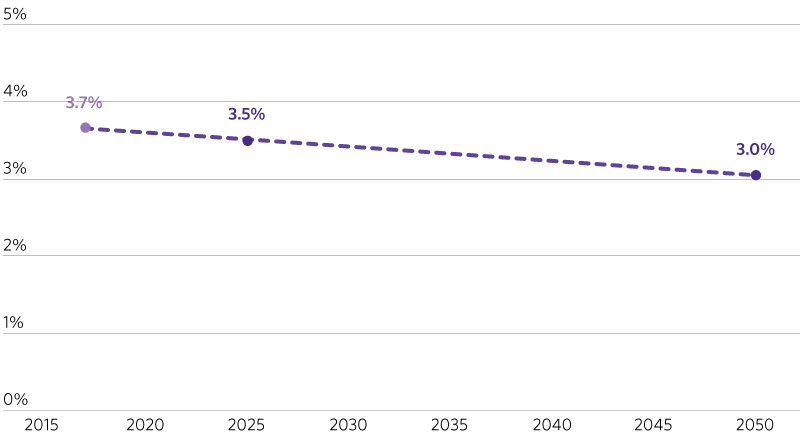
Percent of directional rail route miles with track performance restrictions
This indicator measures the percent of transit rail track with performance restrictions. The CTA refers to these as “slow zones”, where trains are required to operate at slower than normal speeds. This could be the result of construction, power systems, signals, or other issues. Elimination of slow zones can help to make transit more competitive by decreasing travel times and improving reliability. This measure is also a federally required performance measure under MAP-21.
Targets
Slow zones are currently near the lowest they have been in a decade due to a number of small and large track renewal programs, including 2013 reconstruction of the Dan Ryan branch of the Red Line. Remaining slow zones have a number of root causes. For example, trains reduce speed to protect workers in construction zones.
The rail system may always have some level of speed restrictions for safety around construction and unexpected events. Improvements in transit asset management and system reconstruction can help minimize slow zones. Financial projections for ON TO 2050 include funding being directed toward reducing the state of good repair backlog. These targets are consistent with that plan.
2025: 3.5 percent of track or less with performance restrictions
2050: 3.0 percent of track or less with performance restrictions
- Actual
- Target
GO TO 2040 Context
This indicator is new to ON TO 2050. It has replaced GO TO 2040’s “Percentage of Transit Assets in a State of Good Repair” indicator as part of CMAP’s efforts to align plan indicators with the MAP-21 performance measures where significant overlap exists.