Indicator
Regional Land in Watersheds Below 25 Percent Impervious Coverage
This indicator tracks the change in impervious surface by watershed catchment throughout the region as an indicator of health and integrity of aquatic resources. Specifically, it tracks the total percentage of the region’s land area located in watersheds with 25 percent or less impervious coverage.
Many of the region’s water resources are not meeting all goals of the Clean Water Act, and many waterbodies—especially small headwater streams—have not yet been assessed. Given this lack of data, this indicator uses the impervious cover model to understand watershed health and water quality.
Research has shown that small watersheds with less than 10 percent impervious cover tend to be associated with healthy streams. Further increases of impervious cover (up to 25 percent) can lead to impacted streams that could be restored with intervention. Small watersheds with increases in impervious coverage (up to 60 percent) are considered non-supporting, and when impervious coverage exceeds 60 percent, full restoration of urban drainage systems to pre-development habitat quality may not be possible.
Targets
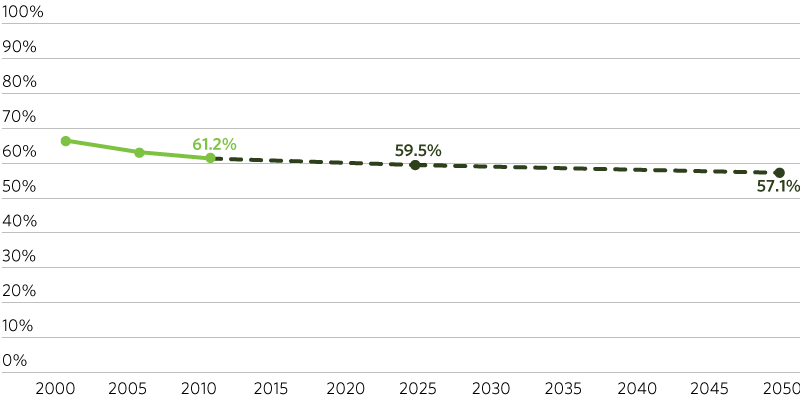
Using NLCD data from 2001-11, past trends were analyzed to understand the recent decline in the proportion of the region in the sensitive and impacted categories. Reflecting the policy goal of maintaining as many watershed catchments in the sensitive and impacted categories as possible, the target methodology assumes that growth in impervious cover will slow as the region’s population and employment density increase through infill and reinvestment. Specifically, the indicator assumes the rate of change for each category will continue at 60 percent of the 2001-11 rate through 2025, and 50 percent of the 2001-11 rate from 2025 until 2050. (These are the same rates as overall impervious acreage increases from the Acres of Impervious Area indicator targets.)
2025: 59.5 percent or more of region’s land in watersheds below 25 percent impervious
2050: 57.1 percent or more of region’s land in watersheds below 25 percent impervious
Sections
- Actual
- Target