GO TO 2040 encourages local decisions that make effective use of land, generate good jobs, and trigger sustainable economic activity. To achieve this, local revenue streams must sustain public services and infrastructure investments that attract and retain both residents and businesses. When making decisions regarding the types and balance of revenue that will be used to fund public services, municipalities must also consider other issues such as quality of life and community, and economic development needs. A number of characteristics drive a municipality's reliance on any one revenue source, such as the types of public services performed by the municipality or its development patterns.
Local revenue sources, though, differ in terms of their stability. Relying on any one source in particular can result in disruptive fiscal impacts, including changes in economic conditions or development patterns. For example, vacant retail properties can drive down sales tax revenue, population declines may decrease income tax revenue, and reductions in property values may lead to increased property tax rates. This variation in revenue stability affects the ability of communities to provide consistent services and maintain tax burdens. In addition, reliance on less stable sources like sales tax revenue may drive increases in the associated rates.
Previous CMAP research examined how utilization of different revenue sources affect the fiscal impact of local developments. This Policy Update will explore reliance on different revenue sources across municipalities in northeastern Illinois, focusing on property, sales, and income taxes, as well as the stability of those funds.
Variation in revenue reliance across municipalities
To analyze revenue reliance, CMAP looked at property, sales, and income tax revenue as a proportion of total revenues in each municipality in northeastern Illinois. The analysis uses 2012 data from the Illinois Office of the Comptroller (IOC), which includes 275 out of the region's 284 municipalities, as well as data from 2009-11, which includes varying numbers of municipalities. This data is self-reported by local governments as required by state statute. The analysis includes revenues in general, special, capital, and debt service funds, and excludes revenues in enterprise, internal service, and fiduciary funds.
Among municipalities in the region, property taxes tend to be a greater source of revenue than both sales tax and income tax revenue. In 2012, property tax was the largest source of revenue for 191 municipalities, sales tax was the largest source for 68 municipalities, and state income tax was the largest source for 16 municipalities.
On the other hand, there are nine municipalities in the region that do not impose a property tax at all. While 121 municipalities do not impose a home rule or non-home rule sales tax, all municipalities receive a share of the state sales tax based on the sales generated within their borders. In addition, all municipalities receive a share of the state income tax. The following maps show the extent that each municipality in the region relies on these major revenue sources, as measured by the revenue source as a proportion of total revenue.

Click on image for larger version.
Characteristics behind varying reliance among municipalities
Municipalities can choose to generate revenues from a variety of sources. In some cases, the predominance of one revenue source is connected to a policy decision not to employ certain tax options, for example. In other cases, reliance on certain revenue streams are associated with different characteristics of the municipality, such as its tax base, its services offered, or its market potential for a given land use type. The extent of reliance on each revenue type depends on the tax rate imposed, the tax base, the extent that other sources are used, and other characteristics of the municipality.
Property taxes
Based on CMAP analysis of the IOC data, many municipalities are heavily reliant on property tax revenue, with 136 generating more than 30 percent of revenues from property taxes. As a result, their property tax rates tend to be higher. After controlling for differential assessment practices in Cook County, effective property tax rates in these communities were twice as high (0.61 percent on average) as in communities that relied on property taxes for less than 30 percent of their revenue (0.25 percent on average).
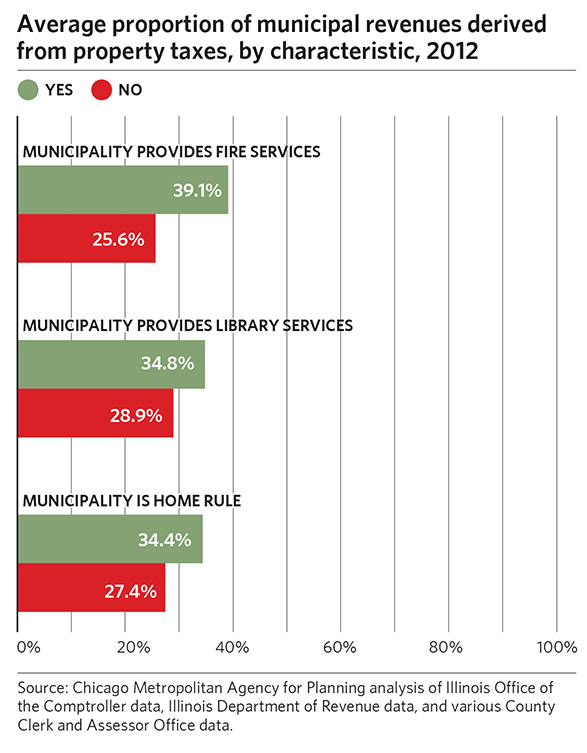
Differences in the services provided by municipalities may partially explain why some communities are more or less reliant on property taxes. Municipalities that provide services such as fire protection and libraries tend to be more reliant on property tax revenues. In other municipalities, some or all of these services are provided by special districts that are often funded primarily through property taxes, so the overall property taxpayer burden may not actually be lower in these communities.
Another major difference in tax reliance between municipalities depends on home rule. Local governments with home rule have authority to expand taxation and regulatory powers, such as implementing sales taxes without a referendum and exceeding statutory limitations on property tax extensions. Home rule municipalities tend to rely more on property taxes than non-home rule municipalities. The following chart shows average property tax reliance across municipalities of different characteristics.
State sales tax disbursements and local option sales taxes
In contrast, some municipalities are very reliant on sales tax revenue. In 2012, 54 CMAP municipalities had more than 30 percent of their revenues comprised by state and local sales taxes. Municipalities with higher reliance on sales tax revenues tended to have larger sales tax bases on a per capita basis, with a median of $28,677 compared to $10,769 for municipalities that have lower reliance. This indicates a preponderance of land uses dedicated to sales tax-generating activities. Potential land uses include retail properties, as well as office or industrial properties where sales are sourced. The preponderance is driven by a combination of local-market demand for businesses and local policy decisions that encourage retail and other sales tax-generating development within their borders. Market factors include a variety of considerations, such as consumer demand, the existence of retail clusters, and the location of distribution networks.
On average, home rule municipalities have higher sales tax reliance (22.6 percent reliant) than non-home rule municipalities (16.8 percent reliant). This is driven by the fact that home rule municipalities are more likely to have a local sales tax than non-home rule municipalities are. Out of the 163 municipalities in the region with a local sales tax, 117 are home rule.
In addition, municipalities that relied more heavily on sales tax revenue were also more likely to have recently increased home rule or non-home rule sales tax rates. Among municipalities that relied on sales tax revenue for more than 30 percent of their overall revenue, 29.6 percent increased or instituted local option sales tax rates between 2009-14, compared to 16.4 percent of municipalities that have lower sales tax reliance. Municipalities with higher sales tax reliance also tended to have lower reliance on property tax revenue, 18.0 percent, compared to 33.9 percent reliance on property tax revenue for municipalities with lower sales tax reliance.
State income tax disbursements
On the other hand, many municipalities rely heavily on state disbursement of the income tax, which is distributed based on population. Just nine of the region's municipalities relied on these disbursements for more than 30 percent of their revenues in 2012. These municipalities may have a preponderance of residential land uses relative to land uses, such as retail, that generate other types of revenue. Municipalities without home rule had a greater reliance on income tax, with the average non-home rule municipality relying on state income tax disbursements for 13.5 percent of their revenue compared to an average 7.8 percent reliance for home rule communities.
Implications for municipal tax reliance strategies
While municipalities have some flexibility in choosing the revenue sources they rely on, the stability of a given revenue source varies. Stable revenues allow municipalities to maintain public services as well as existing tax rates and levies. Relying on a volatile revenue source may increase the chance that a municipality has to reduce public service levels or increase tax rates in any given year. The following chart provides an overview of aggregate revenue stability across several types of local revenues.
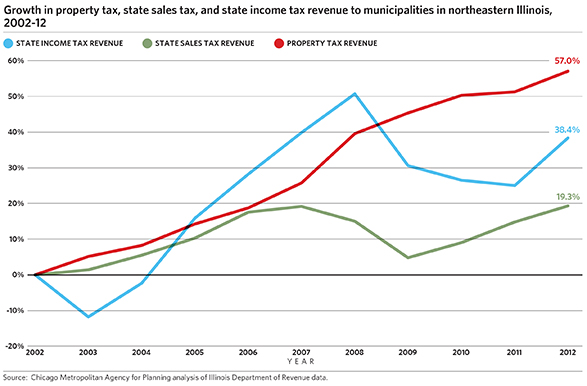
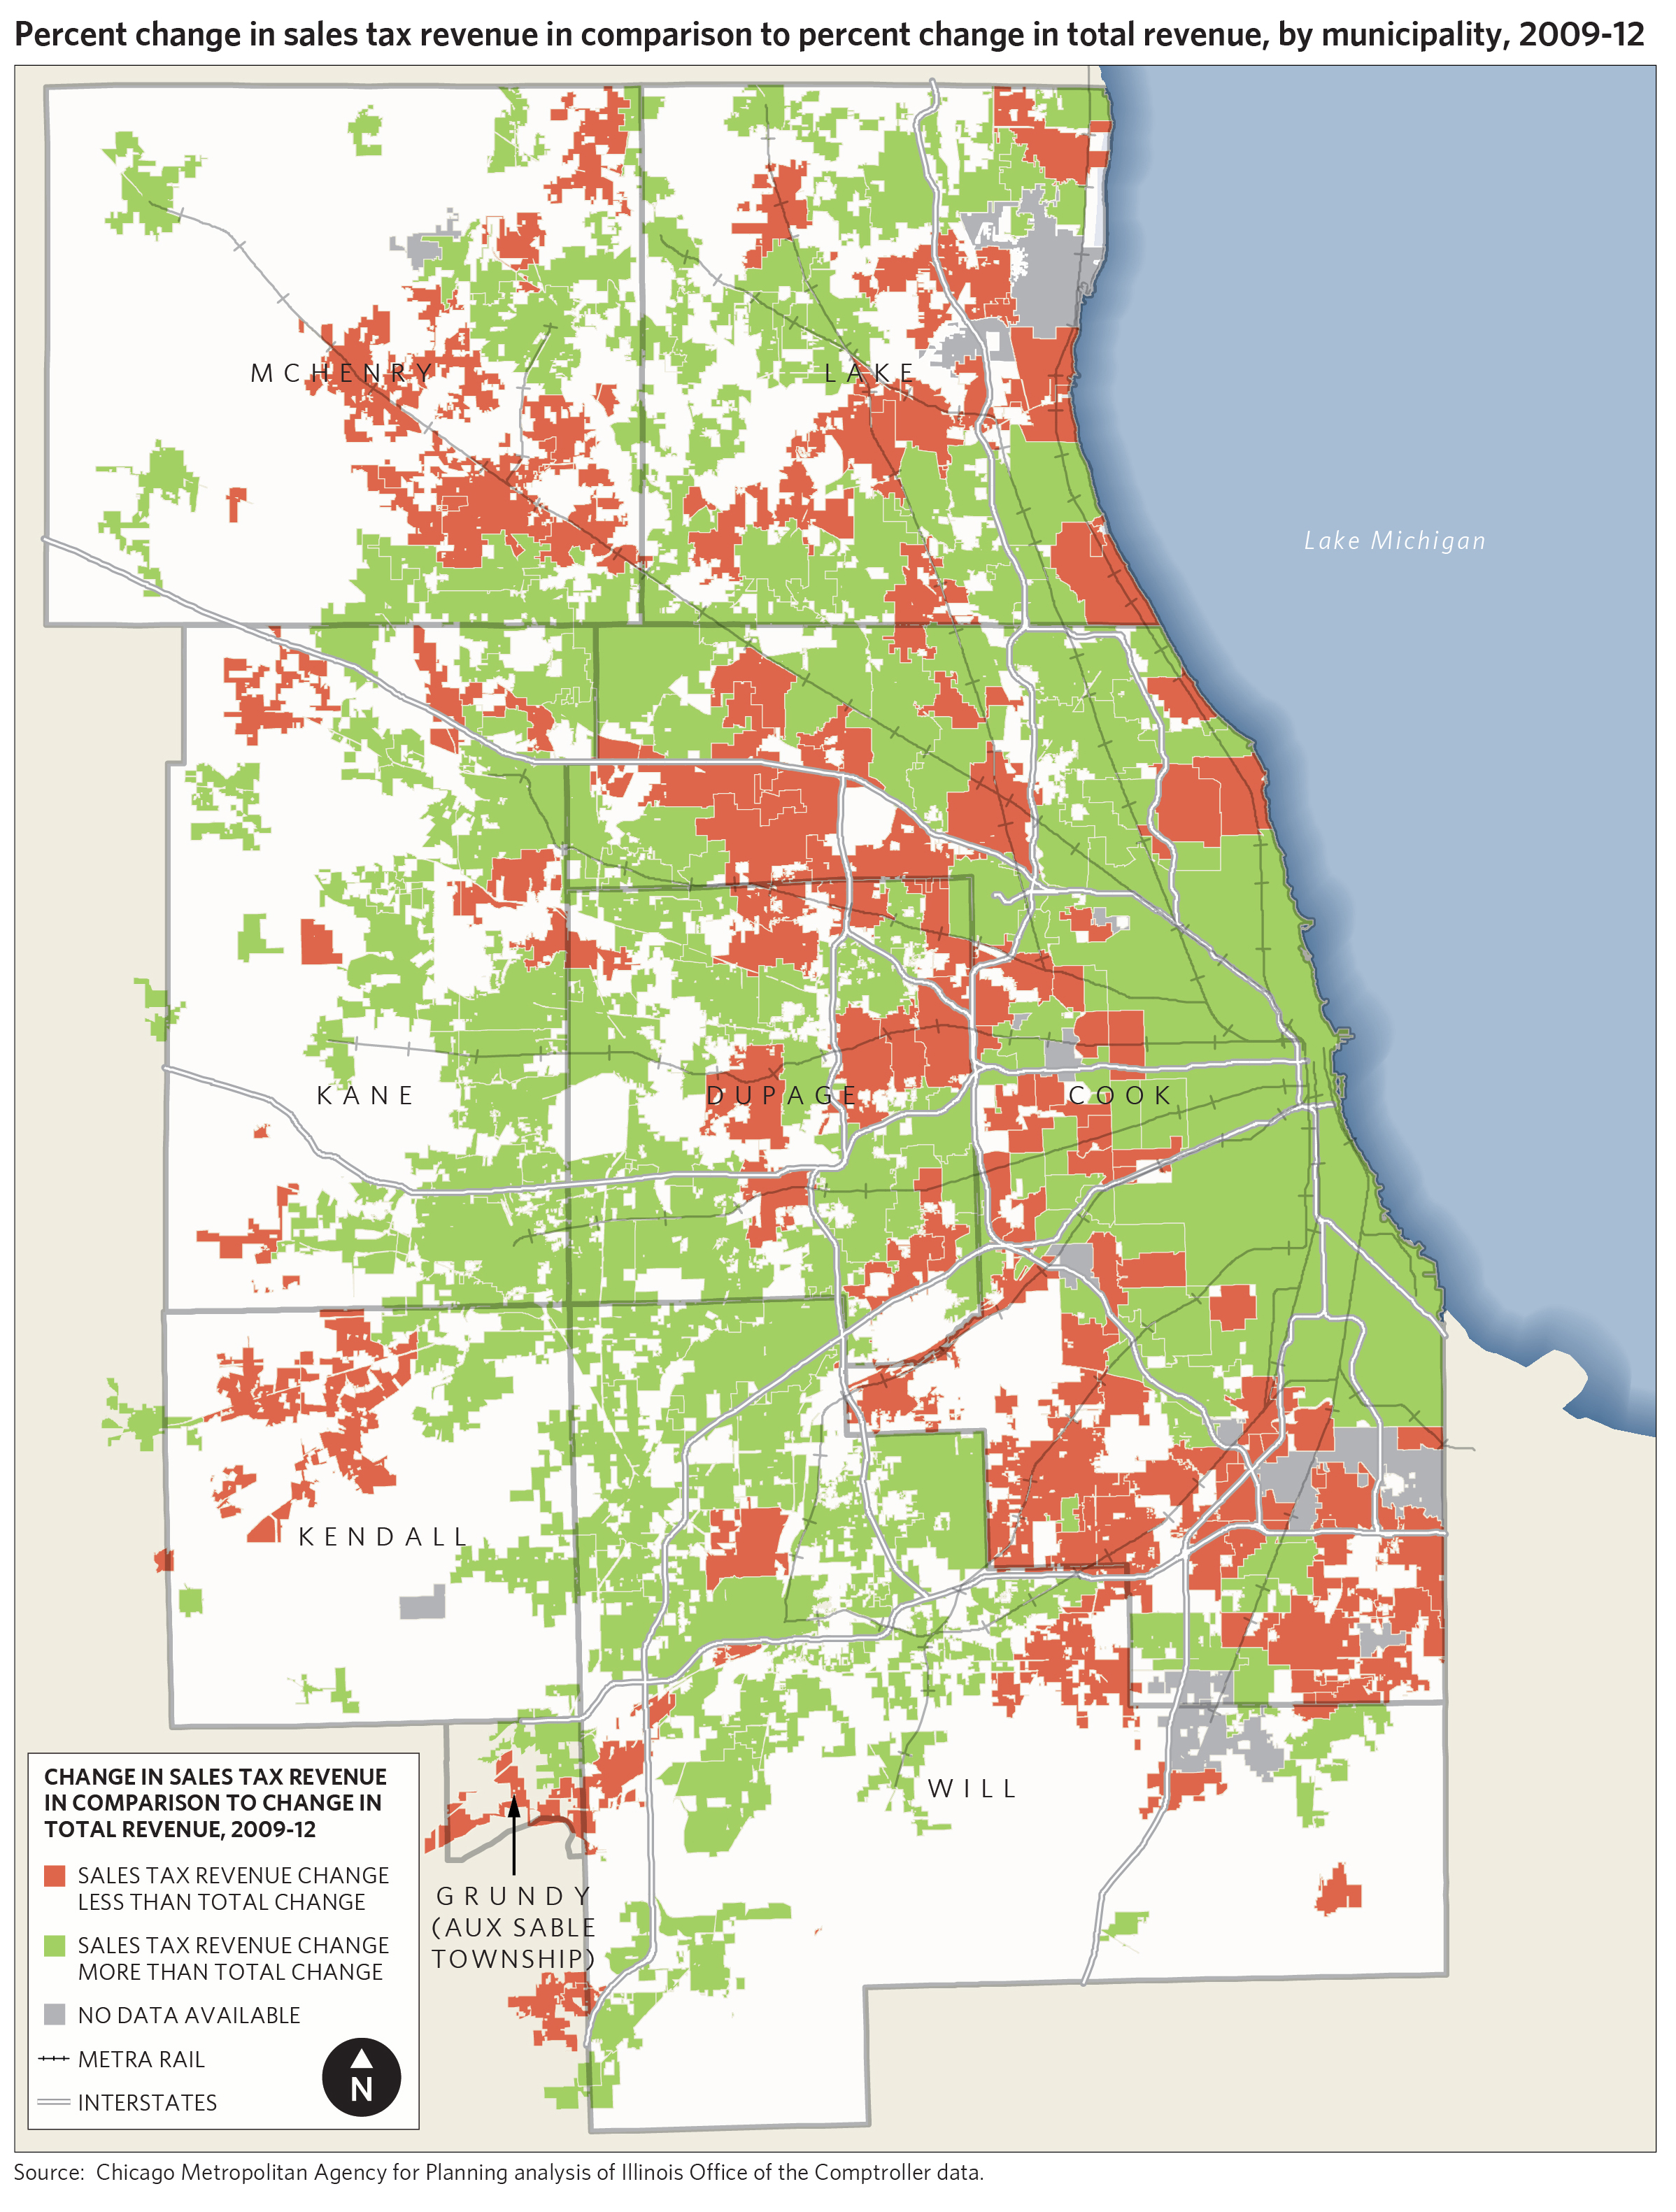
Overall, sales taxes tend to be less stable than property tax revenues. This means that the extent that municipalities can rely on them can vary from year-to-year. Indeed, sales tax revenue in many municipalities has grown slower than overall revenue. The following map provides an overview of sales tax revenue changes in comparison to overall revenue change.
Click on image for larger version.
The level of stability of the sales tax has a number of drivers. One is simply the economic cycle and associated drops in consumption. Most municipalities will experience drops in sales tax revenues during periods of poorer overall economic performance, although the impact varies from place to place depending on the composition of the sales tax base in individual communities. In addition, sales tax revenue can become less of a viable source for communities when retail land becomes vacant, putting communities that rely heavily on sales tax at financial risk.
Local land use decisions that prioritize retail land uses over others may drive the development of excess retail capacity. Underutilized retail property has negative fiscal and economic impacts on a community, as well as the region as a whole. Future CMAP research will examine the landscape of retail vacancies in metropolitan Chicago, which affects the ability of municipalities to rely on sales tax revenue.