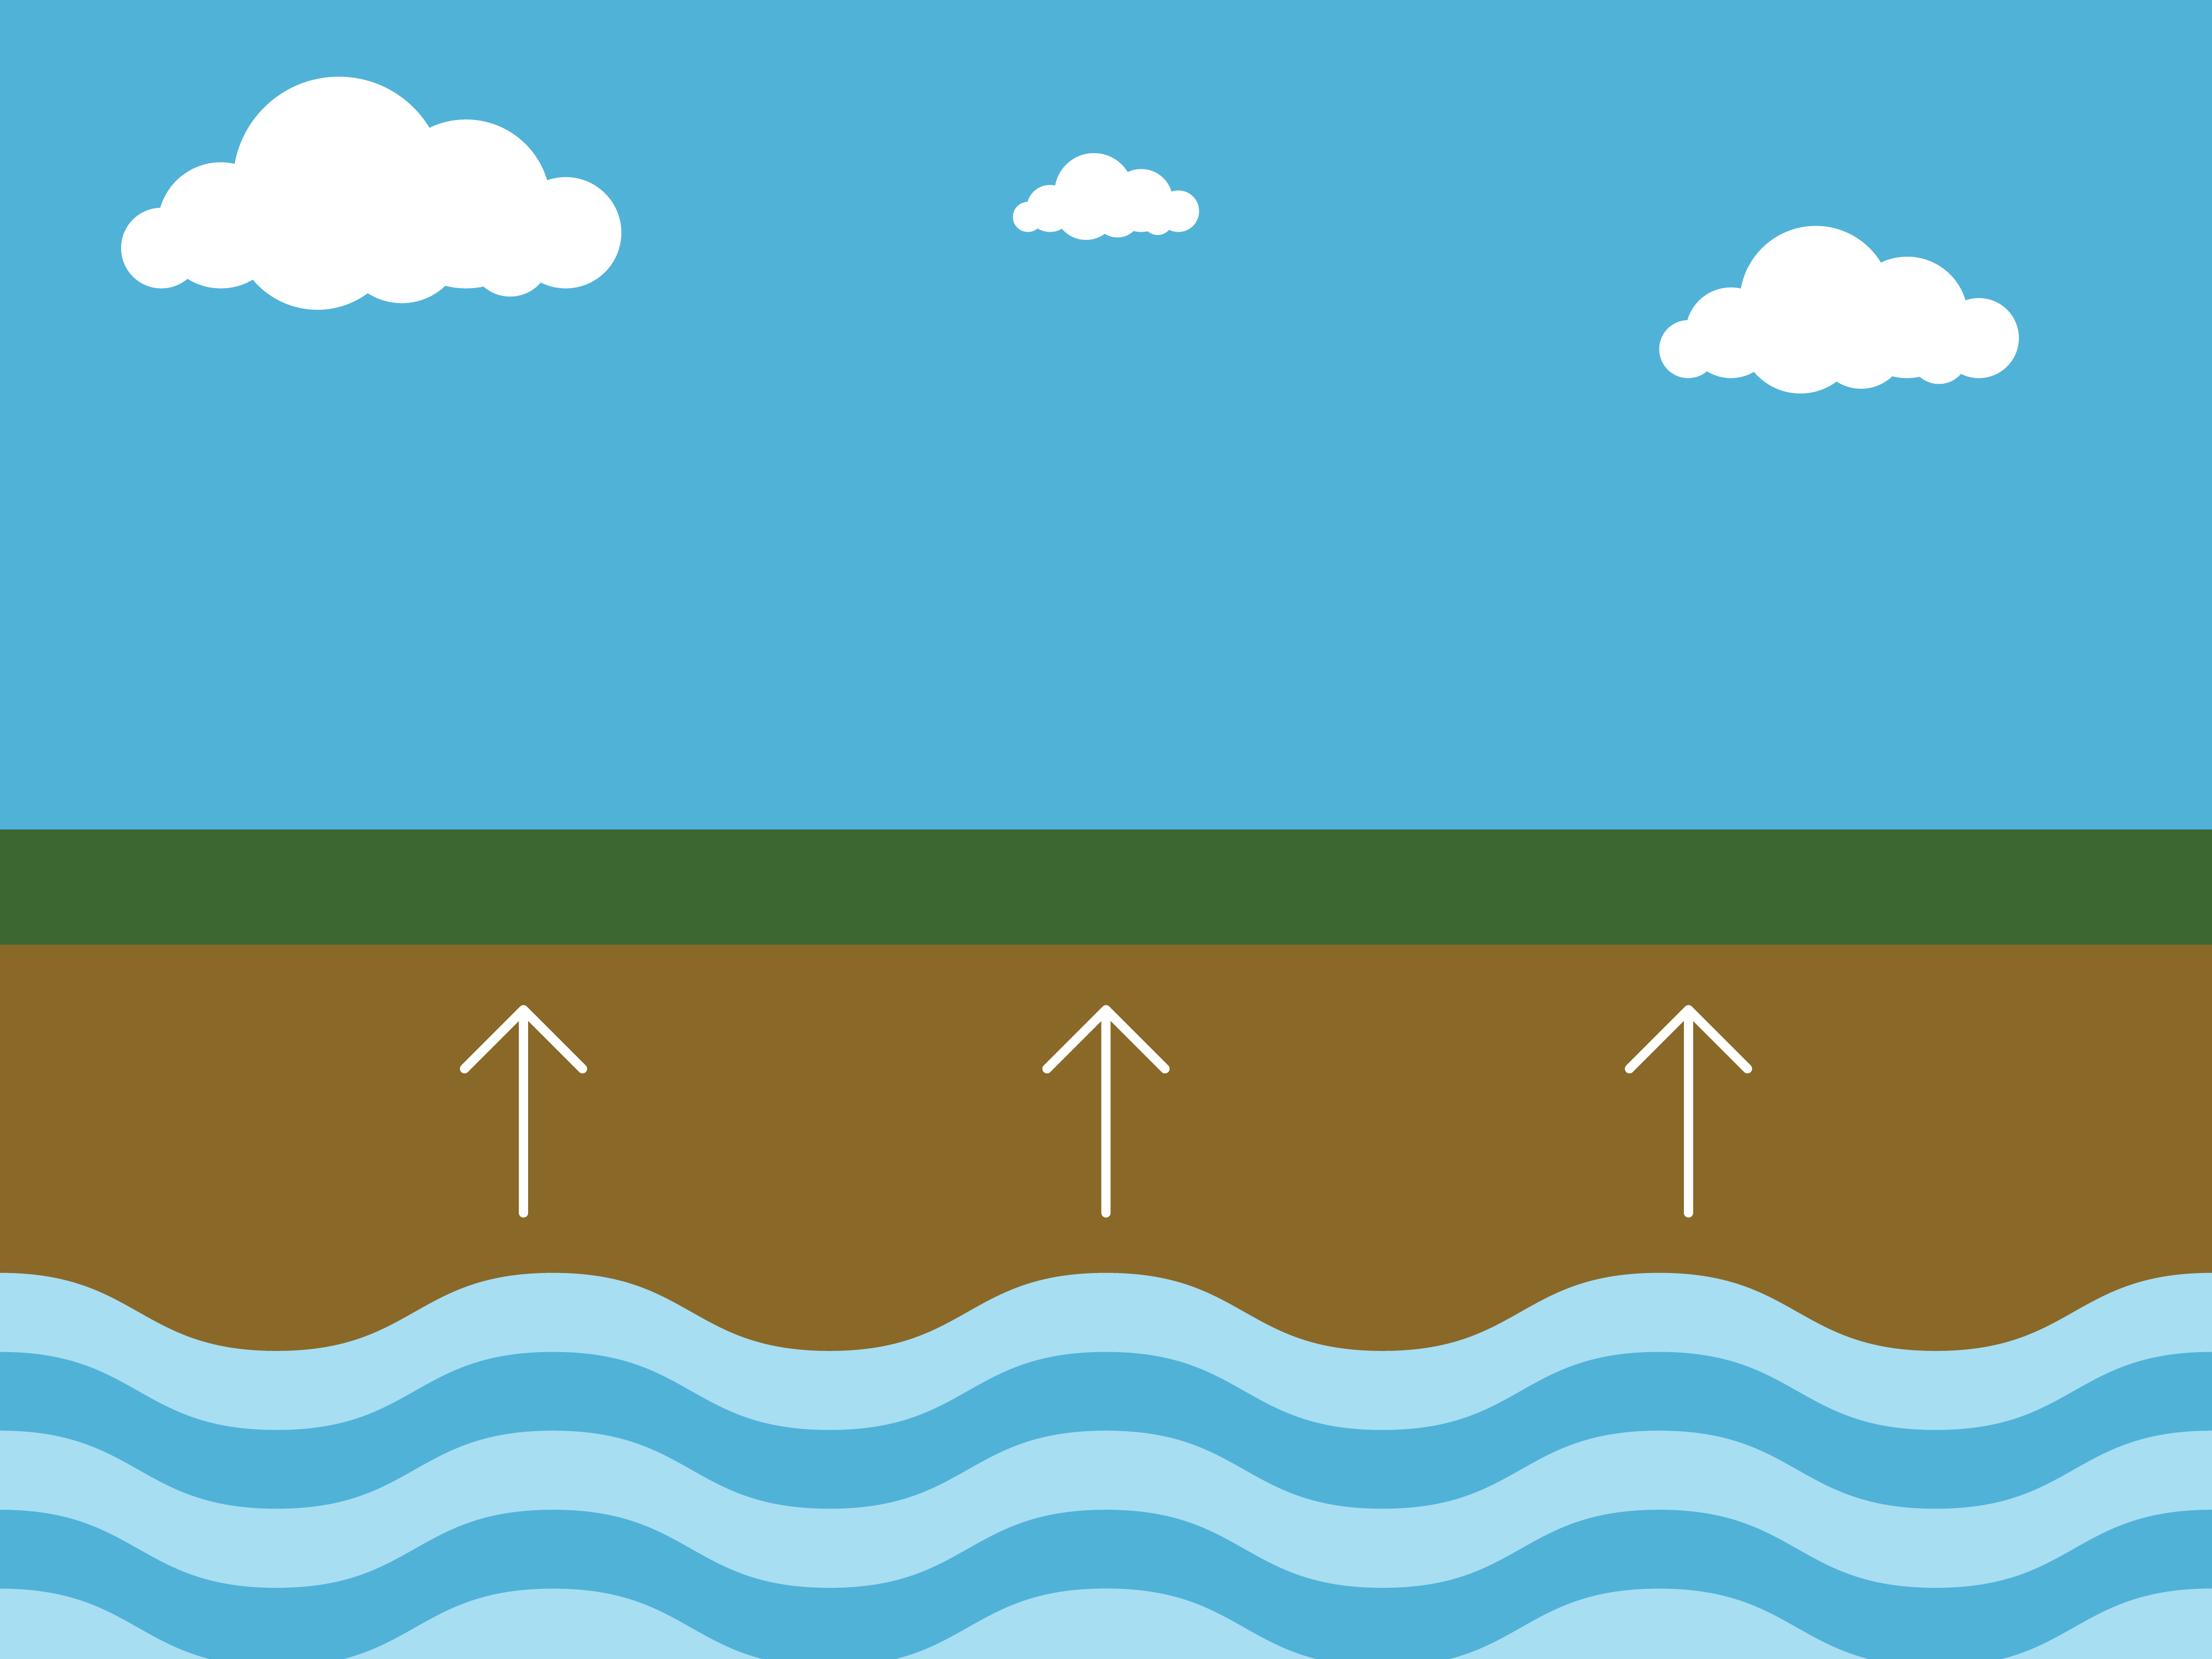
 Population growth and industrial development, particularly in the collar counties, has led to increasing groundwater withdrawals in the Chicago region. In some areas, groundwater is being withdrawn at a rate that exceeds the recharge rate, resulting in decreasing yields, increasing pumping demands, increasing salinity, and the search for alternative water sources, all of which increase the cost of providing water.
The Chicago region’s comprehensive plan, ON TO 2050, includes a recommendation to coordinate and conserve shared water supply resources. The recommendation is based on recent research showing that the long-term sustainability of the region’s groundwater supply is threatened. In addition, the plan recognizes the ongoing challenge of investing in drinking water infrastructure. During the development of ON TO 2050, it became clear that a critical component to making informed land use, transportation, and infrastructure investment decisions was missing – there was no regional data on long-term water demand or recent water rate data – until now.
Using water withdrawal data from the Illinois Water Inventory Program and collecting detailed rate data directly from municipalities, CMAP and Illinois-Indiana Sea Grant (IISG) developed critical water demand and rate data for northeastern Illinois. The two final products, now publicly available on the CMAP Data Hub, include past water use and demand forecasts and water and sewer rate data for each community utility.
Five ways your community can use the data
With a new trove of data available, there are several ways water utility managers, community planners, researchers, and others can use the CMAP and IISG Water data:
1. Examine trends
Is your community’s water rate structure encouraging water conservation? How does housing density impact future water demand? These questions and others can be answered through the new datasets. A community’s water use depends on the number of residents and employees, as well as other demand drivers like housing density, household income, water price, and conservation practices. Understanding current trends as well as how demand drivers contribute to water use is the first step in developing responsive plans.
2. Incorporate forecast data into local plans
The regional water demand forecast projects future water use by municipality to the year 2050. Individual municipalities can download their community’s demand forecast and data on current and projected demand drivers. This information can be incorporated in planning activities, updated to reflect more detailed community data, and used to develop future scenarios by changing the assumptions in the forecast. At a larger scale, groups of municipalities can aggregate the demand forecast data to a sub-regional level and by water source to compare with water supply estimates.
3. Assess equity and affordability
As our infrastructure ages, the cost of maintaining and replacing necessary parts of our water system are passed along to customers in the form of higher rates and fees. Yet many low-income customers are disproportionately affected by rising service costs and may struggle to pay for essential water service as rate increases outpace income growth. Use the water rate data to understand how monthly residential water bills impact your community’s residents. The water rate data helped inform a recent analysis on regional water affordability by the Metropolitan Planning Council, Elevate Energy, and Illinois-Indiana Sea Grant.
4. Track performance
The CMAP and IISG water data can be used to develop performance metrics for water rates, per capita water use, and water conservation for each community. While comparing prices across municipalities is less meaningful since each community has unique utility costs, evaluating performance across time within one municipality can be very insightful. The water rate data is used to inform the Financial Sustainability and Rates Dashboard, which is designed to assist utility managers and local officials in comparing and analyzing water and wastewater rates.
5. Communicate the value of water
We often take our drinking water service for granted, as local utilities quietly deliver water to homes and businesses day in and day out. Yet communities are working to increase people’s awareness of the importance and costs of this service. The theory goes that by understanding the many factors that contribute to delivering clean and safe drinking water, the public will become more involved and invested in drinking water protection. The CMAP and IISG water data provides valuable information that can be used to communicate the value of water in your community.
Add your own
Let us know if you come up with additional ways of analyzing the data or if you have remaining questions about our water supply systems that need further analysis. Send us a tweet about the CMAP Water Demand Data or IISG Water Rate data on Twitter by tagging @onto2050 or using #2050BigIdeas.