UPDATE: The Regional Greenhouse Gas Emissions Inventory has been updated.
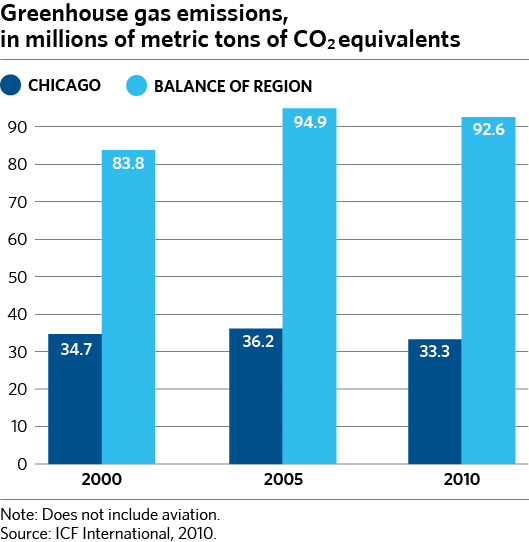
CMAP and the City of Chicago, working with the nonprofit groups Global Philanthropy Partnership and the Civic Consulting Alliance, have completed a regional inventory of greenhouse gas (GHG) emissions for the year 2010. The study continues an effort to catalog emissions at regular intervals to understand trends in metropolitan Chicago. It calculates the carbon dioxide and other GHGs released by burning coal, gasoline, and other fuels in the region, as well as the GHGs produced elsewhere that are attributable to the Chicago region, such as the emissions associated with electricity consumed here but generated out of state. In 2010, the Chicago region emitted approximately 126 million metric tons of carbon dioxide equivalent (MMTCO2e), with emissions from the City of Chicago representing 26 percent of the total. (Five other climate change-causing gases were included in the study, but for comparability, the values are reported relative to the global warming potential of carbon dioxide.)
Relationship to Previous Inventories
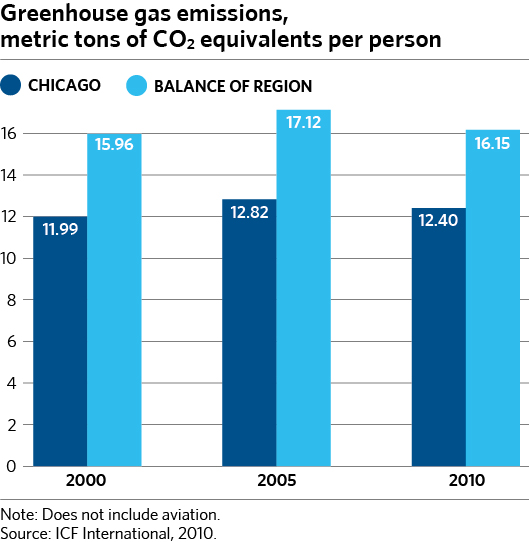
In comparison with similar inventories for 2000 and 2005, the new inventory shows that total GHG emissions for the City of Chicago decreased from 2000 to 2010, with a greater decline between 2005 and 2010. In contrast, total emissions in the seven-county region were higher in 2010 than in 2000. It is worth noting that between 2005 and 2010, the overall decline may be partly attributable to the economic downturn. On a per capita basis, emissions in Chicago increased slightly from 2000 to 2010, while in the balance of the region emissions dropped by a modest amount during the same time period. However, this latter finding is explained by the fact that, according to the 2010 Census, Chicago's population declined in the last decade while the regional population grew over the same time period.
The relative magnitude of GHG emissions in different categories remained about the same as in previous inventories. Energy use in buildings (natural gas and electricity consumption) represents almost two-thirds of total emissions. Emissions from electricity use increased from 2000 to 2005 and then decreased a bit by 2010, which is due to a drop in consumption (itself partly due to the recession) as well as a drop in the carbon intensity of electricity generation in the power market from which ComEd draws its electricity. Emissions from natural gas use fluctuated slightly from 2000 to 2010. While gas consumption itself decreased steadily during that period, other factors came into play as well, the most significant being a change in the method of calculating the carbon content of natural gas for the 2010 inventory.

On-road transportation remains the next-largest emissions category after building energy use, contributing to about 26 percent of the total. At the regional level, both on-road and off-road transportation increased in 2010 relative to the previous years, but this is due mainly to methodological improvements. The remaining categories in the inventory make small contributions to the total. (Methodological improvements in the product use category resulted in a decreased emissions estimate relative to previous inventories.)
Use of the Inventory
Reducing GHG emissions is the central purpose of the Chicago Climate Action Plan (CCAP), and it is a key goal of GO TO 2040 as well. Implementing many of the recommendations in GO TO 2040 -- such as investing in transit, encouraging more compact development, and conducting energy efficiency building retrofits -- will tend to reduce carbon emissions. A basic way of tracking outcomes of plan implementation over time is successive inventories of GHG emissions. Since the emissions value for 2010 used in GO TO 2040 was actually a short-range projection based on 2005 values, the present study provides a baseline correction. Instead of the 132 MMTCO2e reported in GO TO 2040, the 2010 value would be 126 MMTCO2e, a relatively minor change. By contrast, while the City has made significant progress toward implementing CCAP, the 2010 inventory is probably too coarse to detect real changes in emissions due to plan implementation since it began in 2008.
Inventory Methods and Data Availability
The methodology includes a few new wrinkles relative to previous work. For on-road transportation, it uses the U.S. Environmental Protection Agency (U.S. EPA) MOVES model, which includes more information on vehicle characteristics and is sensitive to the effects of congestion. Previous inventories had used a simple multiplier of annual vehicle miles traveled. The 2010 inventory suggests that congestion in the Chicago region increased on‐road GHG emissions by 5 – 7 percent, depending on modeling assumptions. Off-road transportation estimates relied on the U.S. EPA NONROAD model as well as a detailed GHG inventory for the transit system conducted by the Regional Transportation Authority that had not previously been available. The inventory included an estimate of carbon sequestration, the amount of carbon removed from the atmosphere each year by trees and other vegetation in the region. The results suggest that vegetation offsets 1.3 percent of annual GHG emissions. Finally, this also marked the first time that CMAP and the City of Chicago collaborated on a GHG inventory -- previous inventories were done separately.
The method of calculating emissions from building energy use was improved slightly from previous inventories but remained essentially the same, particularly in one frustrating aspect. It still required collecting consumption data from at least six utilities in the region. While the utilities have ultimately been very helpful in providing the data, there is no standardized process for requesting it. Personal contacts and persistence are the main tools for obtaining utility data. Long wait times are involved, and there may be restrictions on its use, even in aggregate form. The Improve Access to Information section of GO TO 2040 noted the importance of easing the availability of comprehensive and current data. Future inventories would be much easier and less expensive if regular, automatic updates of utility consumption data were available by county or other geography, preferably via the web.
The data behind the 2010 inventory can be found on CMAP's Technical Reports web page under Water and Environment.