Indicator
Acres of Impervious Area
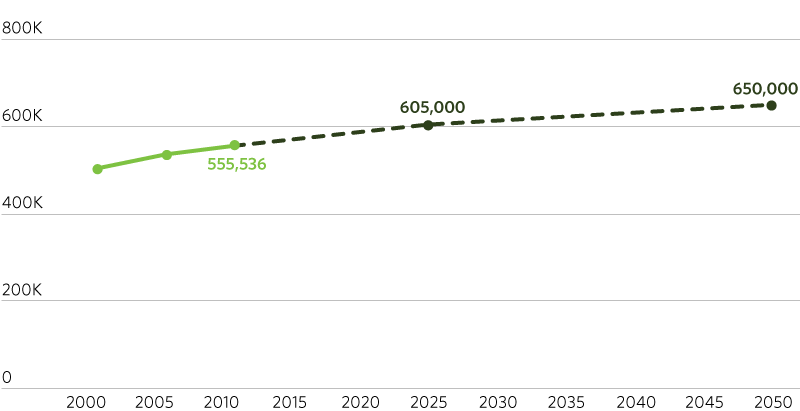
This indicator measures the total number of acres of impervious surfaces in the region; it is the entire amount of hard surface (such as buildings, sidewalks and streets) in the landscape. Imperviousness is an important environmental indicator because it is negatively associated with various measures of the biological health and physical integrity of surface waters.
Targets
CMAP’s regional socioeconomic forecast projects that households and jobs will each grow by approximately 16 percent over 2010 levels by 2025, and by approximately 36 percent over 2010 levels by 2050. The target methodology assumes that growth in impervious cover will slow from the current rate as the region’s population and employment density increase through infill and reinvestment.
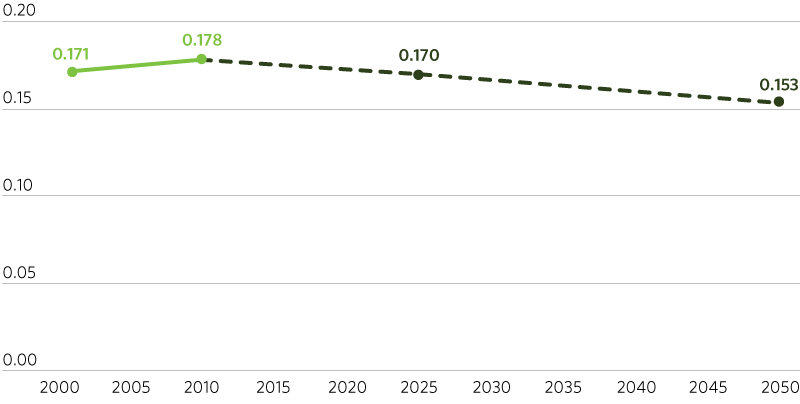
The 2025 target for impervious acreage represents growth rate in impervious cover from 2010 equal to 60 percent of the rate of household and job growth over the same period (i.e., a 10 percent increase in acreage over 2010). The 2050 target represents growth in impervious cover from 2010 equal to 50 percent of the rate of household and job growth over the same period (i.e., an 18 percent increase in acreage over 2010). While the targets show growth in total impervious acreage, they represent a continual (and accelerating) decline in the region’s impervious area on a per-household, per-capita, and per-job basis.
2025: 605,000 acres or less of impervious area
2050: 650,000 acres or less of impervious area
Sections
- Actual
- Target

The following chart shows how the impervious acreage targets translate to a per-household rate, based on forecasted numbers of households from the ON TO 2050 socioeconomic forecast. While growth in impervious acreage has recently outpaced growth in households, the targets would reflect a reversal of this trend.
- Actual
- Target

GO TO 2040 Context
This indicator has been carried forward from the GO TO 2040 Plan Update. However, there has been no new data released since the Plan Update was written, so no evaluation can be made of implementation progress at this time. The Plan Update set 2020 and 2040 targets of 590,000 and 640,000 acres of impervious area, respectively, which are largely in line with the ON TO 2050 targets.