GO TO 2040 calls on CMAP to track indicators and set targets on the efficiency, equity, and transparency of the state and local tax system. This is the first in a series of Policy Updates that will examine CMAP's tax policy indicators. This post outlines how CMAP views tax system efficiency. Future posts will examine indicators that track equity and transparency. An efficient tax system minimizes economic distortions by having a broad, rather than narrow, tax base. A tax base with fewer exemptions or limitations that covers a broader scope of the economy improves revenue stability and helps revenues increase based on growth in the economy. A broad tax base also allows for lower tax rates, which can enhance economic competitiveness.
To judge the region's success in broadening the tax base and lowering rates, this Policy Update analyzes the composition of the tax base and the extent to which the tax base allows for low tax rates. CMAP will focus on three tax types: the sales tax, the individual income tax, and the property tax. When available, tax data from the northeastern Illinois region is used in the analysis; otherwise, statewide data is used.
Sales Tax
Illinois imposes a sales tax rate of 6.25 percent, although the rate can reach as high as 9.5 percent in some jurisdictions after including county, municipal, and Regional Transportation Authority sales tax rates. In the CMAP region, general merchandise and other sales included in the sales tax base totaled $109.4 billion in 2012. Excluding sales of food, drugs, and medical appliances that are taxed at a lower rate, revenues generated from general merchandise totaled $7.5 billion in the region in 2012, resulting in an aggregate rate of 8.4 percent. The following chart provides an overview of the aggregate sales tax rate in the state from 2007-12.
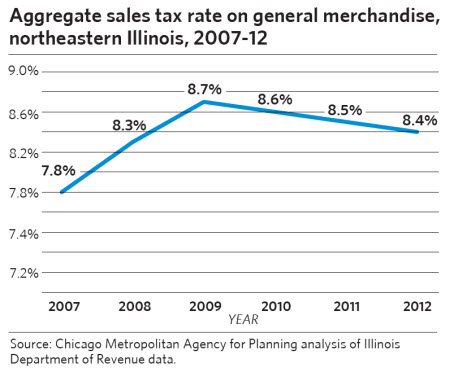
Click for larger image.
This aggregate sales tax rate is high compared to other parts of the country. Nationally, the median state and local combined sales tax rate is 6.8 percent. In Illinois, revenue generated from state and local sales taxes totaled $12.4 billion in 2012, resulting in an aggregate statewide sales tax rate of 7.5 percent. Like Illinois, other Midwestern states including Iowa, Missouri, and Wisconsin have both state and various local sales tax rates. Among its neighbors, Illinois has the second highest sales tax rate. However, in many Illinois jurisdictions the rate is more than 9 percent, significantly higher than the rates imposed by neighboring states. The following chart shows the Illinois sales tax rate relative to neighboring states.
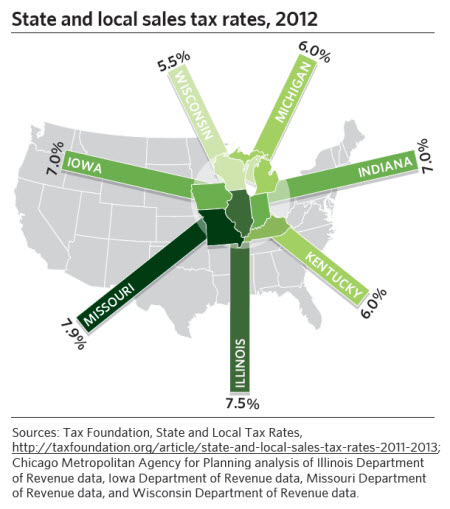
Click for larger image.
Not all forms of consumption are included in the sales tax base statewide. For example, some purchases such as farm chemicals and sales to not-for-profit organizations are exempted under Illinois statute, resulting in an estimated revenue base reduction of $36.0 billion. In addition, the State of Illinois taxes qualifying food, drugs, and medical appliances at a lower sales tax rate of 1 percent, resulting in a net loss to the tax revenue base of approximately $21.3 billion. These base reductions are equivalent to nearly half of taxable sales. If the tax base excluded fewer types of consumption, either more revenue could be generated under the current rates or the rates could be reduced. The following chart compares these taxable sales exemptions for 2007-11.

The sales tax base also does not include most services. Illinois includes 17 services in its sales tax base, which is relatively low in comparison to other states. Nationally, the median state sales tax base includes 55 services. Consumption of services in Illinois totals an estimated $16.6 billion. The following chart shows the number of services in our state's sales tax base compared to surrounding states.
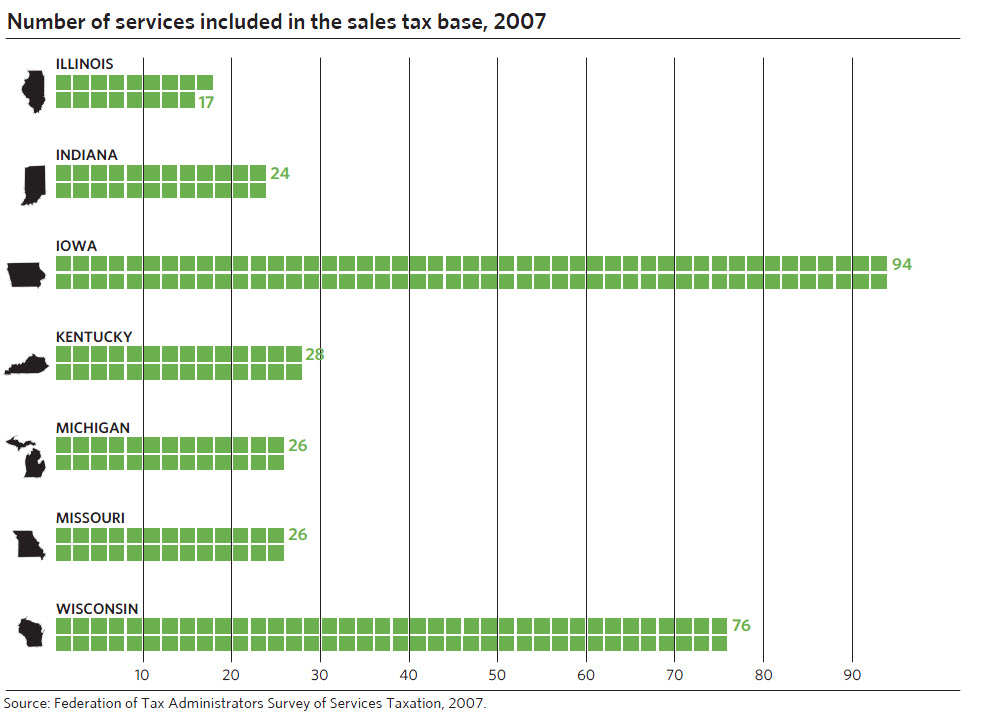
Click for larger image.
Expanding the sales tax base to include exempted and excluded goods or services and lowering the rate would improve the efficiency of the sales tax in Illinois. However, it is not necessarily optimal to include all goods and services in the sales tax base. For example, there are important policy reasons for leaving some types of consumption out of the sales tax base, which CMAP explored in a prior Policy Update.
Still, by taxing the consumption of goods but only a few services, the current sales tax is based on the type of product consumed rather than on the actual scale of consumption. This results in an economic distortion in which the tax system itself is influencing economic activity. The tax system would exert less influence over consumer choice if additional services were taxed. Also, lowering the sales tax rate would further reduce economic distortions. In addition, the region could better compete for economic development opportunities with other regions that have lower sales tax rates.
Individual Income Tax
The State of Illinois imposes an individual income tax of 5 percent. Illinois does not allow local governments to impose income taxes. In 2011, the rate increased from 3 percent to 5 percent until 2015, when the rate will drop to 3.75 percent. Starting in 2025, the rate will drop again to 3.25 percent. The following graph charts this change as enacted in Illinois Public Act 96-1496.
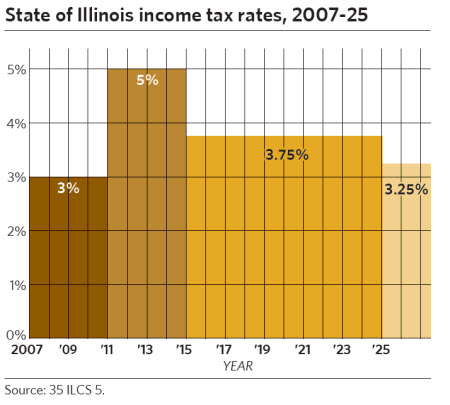
Click for larger image.
Despite the recent income tax rate increase, the rate remains close to those of neighboring states. The following chart compares our neighbors' current individual income tax rates, including Michigan and Indiana's flat rates and the graduated rates (in which different rates apply based on taxpayers' income levels) of Iowa, Kentucky, Missouri, and Wisconsin. The chart does not include locally imposed rates.
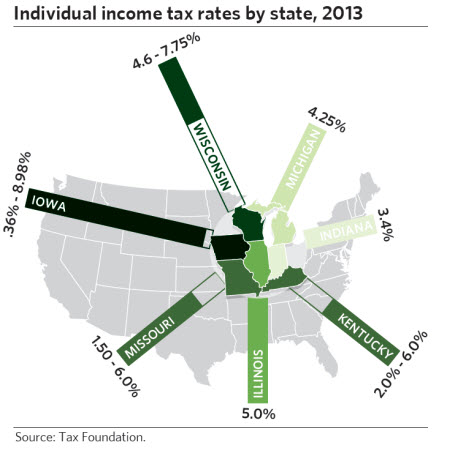
Click for larger image.
Base income subject to this tax includes federal adjusted gross income (AGI) with several additions (e.g., interest, dividends, and capital gains excluded from federal AGI), as well as several subtractions (e.g., retirement and social security income). These subtractions are called "tax expenditures," which are "any exemption, exclusion, deduction, allowance, credit, preferential tax rate, abatement, or other device that reduces that amount of tax revenue that would otherwise accrue to the State," according to the Illinois Office of the Comptroller. This deduction for federally-taxed retirement and social security income accounts for the largest individual income tax expenditure in Illinois -- over $1 billion. Over time, the relative size of the tax expenditure has remained stable (generally between 8 percent and 10 percent of total revenues). However, the exemption for retirement income is likely to experience relative growth as the state's population ages. The following chart provides an overview how the amount of the individual income tax expenditures compared to total individual income tax revenues between fiscal years 2007-11.
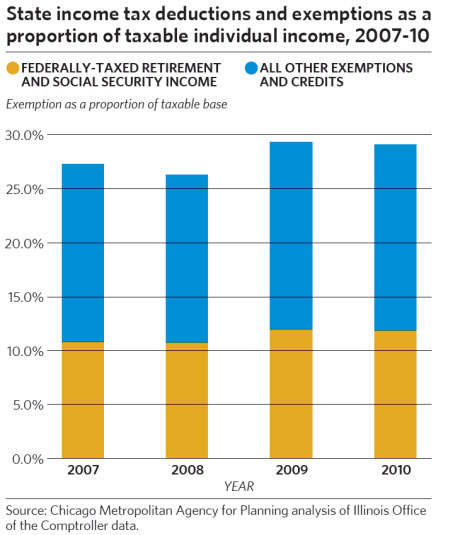
Click for larger image.
Forty-one states impose income taxes. While the federal government includes a portion of retirement and social security income in the federal income tax base, Illinois is one of 26 states to exclude social security income and one of three to exclude all pension income from its individual income tax. The following chart compares how Illinois taxes retirement income relative to neighboring states.
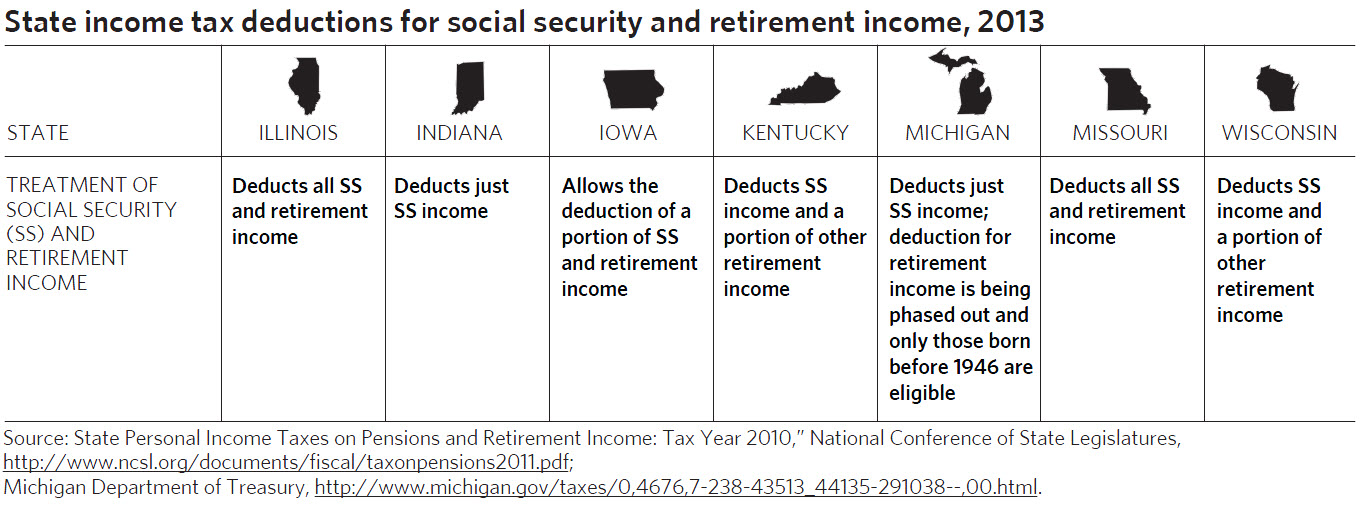
Click for larger image.
Including retirement income in the Illinois income tax base would provide a more stable revenue source as our State's demographics change. Ensuring the future stability of one of the State's largest tax revenue sources is especially important in the current fiscal environment. Stabilizing the state government's fiscal condition is one way to make Illinois more economically competitive.
Property Tax
The vast majority of local governments in Illinois impose a property tax. Assuming a well-designed system, the property tax is an effective and efficient means of raising local revenues. Individual taxing bodies have their own levy rates that are individually determined by the relationship between their annual financial requests and the assessed value of property within their geographic boundaries. Rates can be understood as a function of the need for services, the value of real property, and other revenue sources. The rates are generally determined according to a simple formula (tax levy / EAV = tax rate), where tax levy refers to the funds requested by the taxing bodies and EAV refers to the equalized assessed value of all properties within a taxing district.
The composite rate extended to each taxpayer depends on the set of taxing districts that encompass the property. In the aggregate, property taxpayers in Illinois paid $26.2 billion in 2011. The EAV, which is the tax base, totaled $348.1 billion and is estimated to account for approximately $1.0 trillion in market value. As a percent of estimated market value of properties (called the effective rate), Illinois taxpayers incurred an aggregate 2.5 percent property tax rate in 2011. This has been rising annually. The following table shows aggregate effective property rates in northeastern Illinois for tax years 2007-11.
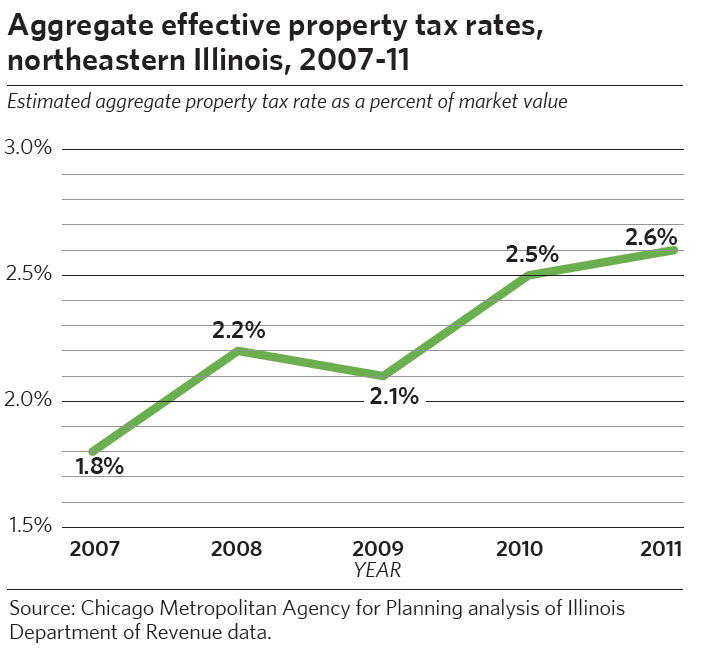
Click for larger image.
Due to limited data, property tax collections per capita in Illinois in comparison to other states is examined instead of aggregate effective property tax rates. Statewide, Illinois collects higher levels of property taxes in comparison to other states. The following table compares Illinois to neighboring states using property tax collections per capita.
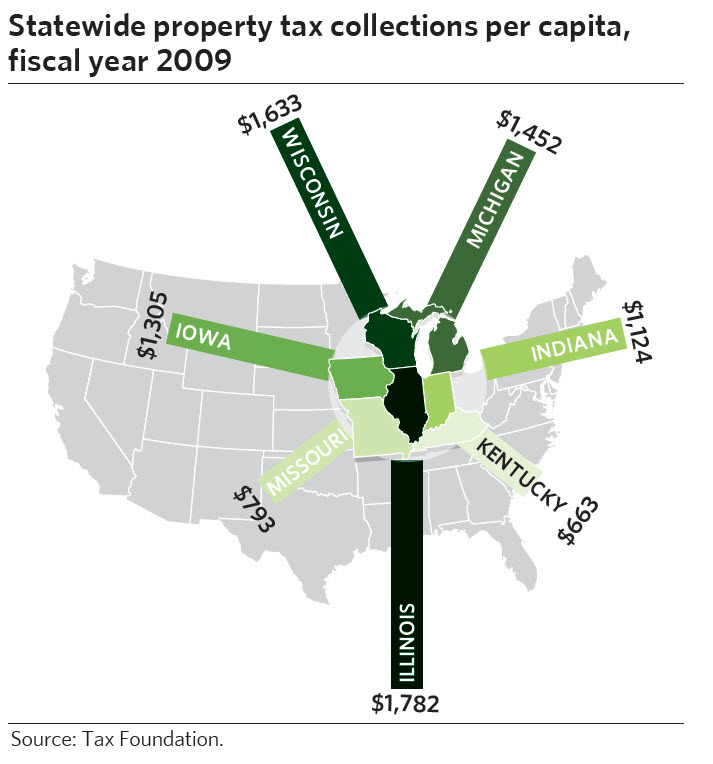
Click for larger image.
In Illinois, properties used for educational, religious, governmental, or charitable purposes are exempt from the property tax. In addition, a variety of exemptions are used to reduce the taxable value of residential properties. The general homestead exemption makes up the largest amount of property value exempted from the tax base in the region. In addition, the alternative general homestead exemption in Cook County, which is being phased out, exempted a significant portion of residential tax base. Other exemptions serve to reduce property taxes for specific taxpayers, such as seniors or veterans.
All of these exemptions reduce the overall property tax base on which extensions can be levied. If the property tax base decreases, the rate must rise in order to achieve the same level of revenue. This higher rate would be imposed on all taxpayers, including those that did not benefit from an exemption. Exemptions have been lower in recent years, primarily as a result of the phase out of Cook County's alternative general homestead exemption. The following chart provides a history of the region's value of residential property tax exemptions, shown as a proportion of the total taxable base.
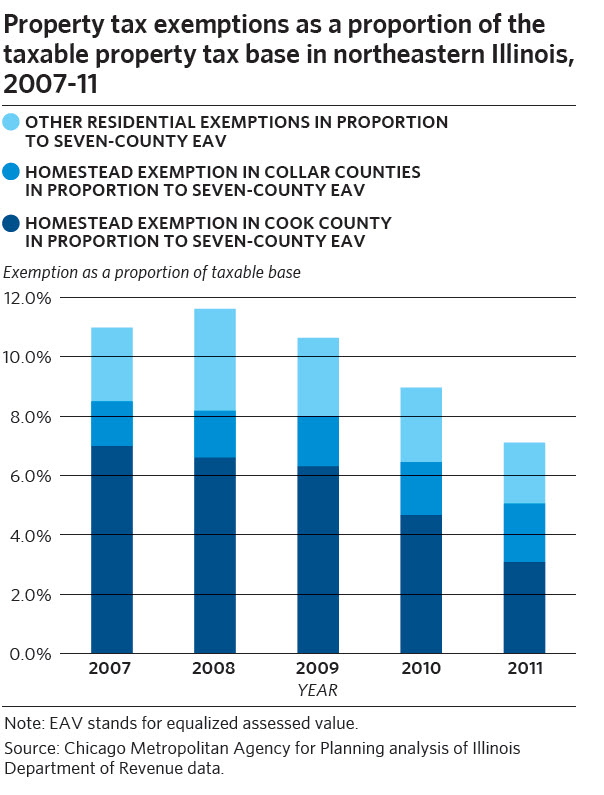
Click for larger image.
In addition to the exemptions discussed previously, Illinois exempts personal property from its tax base. Personal property was abolished from the tax base in 1979. The loss in revenue was replaced with an income tax on businesses and an invested capital tax on public utilities called the Personal Property Replacement Tax. However, many other states continue to include personal property in the property tax base. The following chart provides an overview of how neighboring states treat personal property for property tax purposes.
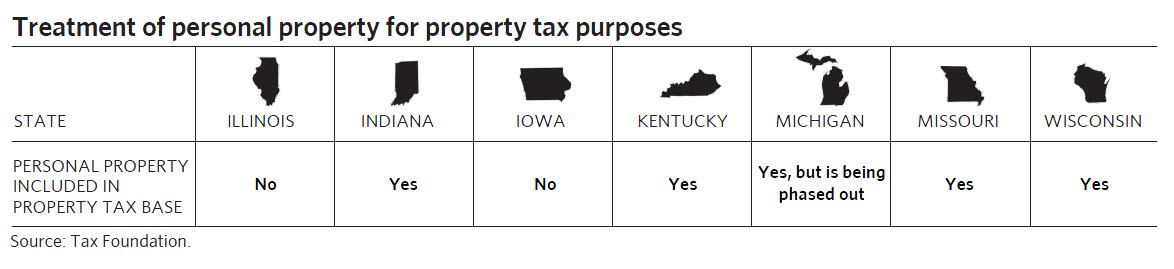
Click for larger image.
There are many policy reasons to exclude personal property from the tax base. When it was abolished in Illinois, there had been problems with both accurate assessment and collection of the taxes on personal property. However, it also represents another type of property excluded from the tax base, which serves to drive up property tax rates.
Conclusion
Overall, Illinois' tax system provides many exemptions that some other Midwestern states do not provide to taxpayers. At the same time, Illinois tax rates are often similar or higher than other Midwestern states. For example, Illinois includes relatively few services in its sales tax base while imposing relatively high rates and provides more retirement income deductions than other states while imposing similar income tax rates. If Illinois were to expand its tax base, it may be able to lower rates, which would make the State and the region more competitive with its neighbors.
The region would benefit from new tax policies that help to advance GO TO 2040's goal for sustained regional economic competitiveness. Implementing tax system reforms that reduce economic distortions, broaden the tax base, and lower tax rates would increase the efficiency of the tax system. Lowering tax rates for businesses by broadening the tax base would help the region compete more effectively for economic development opportunities. In addition, broadening the tax base to include a broader scope of the economy would improve revenue stability and help revenues increase according to growth in the economy.