Between 2000 and 2009, metropolitan Chicago has seen the addition of 6 municipalities and more than 300,000 people, spawning a total population of 8,460,117 residents. In addition to this 3.8% population increase, the CMAP region's aggregate household income rose by 25 percent. Much of this population and household income growth occurred in outlying areas of the region. The majority of municipalities that lost population were in Cook County, while the majority that gained population were in collar counties (DuPage, Kane, Kendall, Lake, McHenry, and Will). Meanwhile, most of the Cook County municipalities that lost population also experienced slower growth in median household income (MHI) than the seven-county region did as a whole. At the same time, the number of municipalities having MHIs within 20 percent of the region's median dropped between 2000 and 2009.
Understanding population and income growth patterns can help decision makers address quality of life, economic development, and fiscal issues that arise in the region's communities. Economic and demographic conditions can indicate changes in current circumstances and forecast future issues, such as changes in municipal government revenue or shifts in commuting patterns. This CMAP Policy Update will examine changes in population and household income patterns among municipalities in the region since the 2000 decennial census. Because data are not yet available for the 2010 decennial census, the following analysis uses data from the U.S. Census Bureau's American Community Survey based on samples from 2005 to 2009. Detailed population counts for the 2010 census will be released in February or March of this year, although 2010 figures for household income by municipality may not be available until later in 2011 or 2012.
Socioeconomic and Population Change in the Region's Municipalities
The CMAP region has seen 102 municipalities lose population since 2000, while 150 municipalities experienced slower growth in MHI than the CMAP region as a whole. The CMAP region saw an 18.2 percent increase in MHI from $52,426 in 2000 to $61,985 in 2009, which was estimated by taking the weighted-average of the median household income in each of the seven CMAP counties. The following table summarizes how the region's growth in MHI compared to municipalities' change in MHI and population. The CMAP region currently has 284 municipalities, but only the 278 municipalities incorporated in both 2000 and 2009 are included in this analysis.
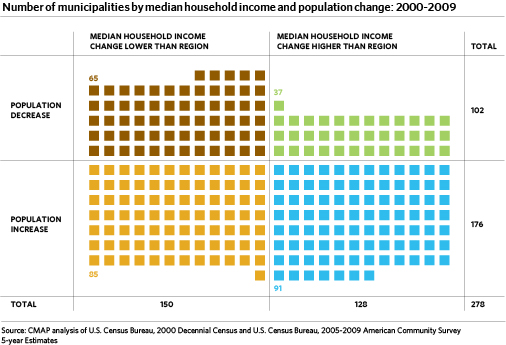
Of the municipalities with population decline between 2000 and 2009, 37 of them experienced higher MHI growth than the region experienced. Although the population of these municipalities has been declining, their residents -- which account for 13.3 percent of the municipalities in the region -- may be better off economically than in 2000. All but five of these 37 municipalities are within 20 miles of Chicago, and 28 of them, including the City of Chicago, are located in Cook County. Despite a 2.5 percent drop in Chicago's population since 2000, the city has seen its MHI grow 21.1 percent since 2000. The following map illustrates how population and MHI patterns changed in the region between 2000 and 2009.
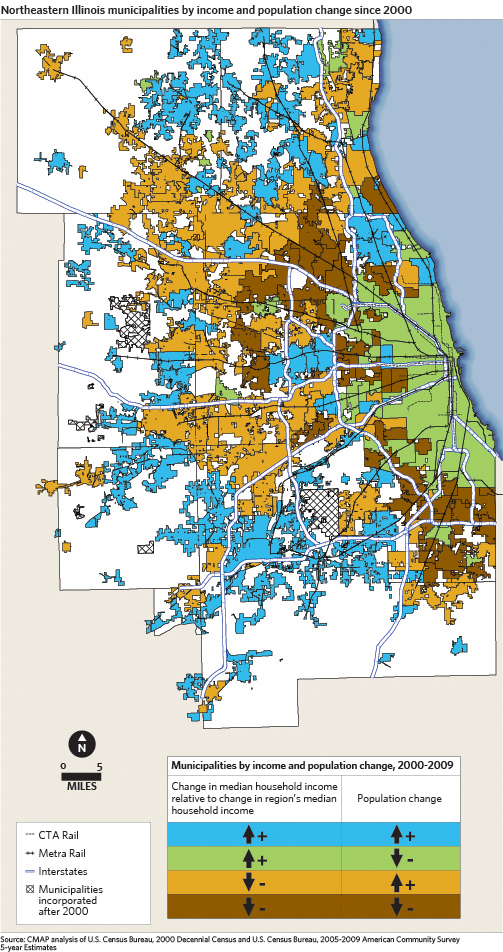
Most municipalities that lost population also experienced slower growth in MHI compared to the regional median. Just under a quarter of the region's municipalities both lost population and had a change in MHI of less than 18.2 percent. None of these 65 municipalities, shown in brown on the map, is more than 20 miles from Chicago, and 55 are in Cook County. Additionally, of the eight municipalities that experienced a drop in population as well as an actual decrease in MHI, seven were in Cook County. The countywide data for Cook County, which includes data on residents and households in municipalities and unincorporated areas, also demonstrates this trend of population decline and comparatively slow MHI growth. Between 2000 and 2009, Cook County experienced a 2.2 percent drop in population and a 17.4 percent increase in MHI.
While Cook County has lost population, the collar counties have grown. Each collar county experienced population increases, but DuPage, Kane, and Lake counties experienced slower MHI growth than the region. Just under half of the 176 municipalities where population increased also have experienced comparatively slower growth in MHI than the 18.2 percent increase in the region's MHI. Of the 85 municipalities with increased population but slower MHI growth than the region, all but 20 were located in the collar counties. Determining why these 85 municipalities, shown in orange on the map, gained population while MHI growth did not keep pace with the region would require additional information and analysis.
Finally, about a third of the region's municipalities experienced both population growth and faster MHI growth than the region. All but 16 of these 91 municipalities, shown in blue on the map, were in the collar counties. Forty-two of the 76 municipalities that are more than 20 miles from Chicago both grew in population and had MHI growth rates higher than the regional median.
Household Income Disparities among Municipalities
Most of the municipalities with population growth and faster MHI growth also have relatively high median household incomes. Of the 91 municipalities to experience growth in population and faster growth in MHI than the region, 82 of them had median household incomes above the regional median in 2009. Likewise, just 20 of the 65 municipalities with slow MHI growth and population declines had an MHI higher than the region in 2009.
In addition, median household income disparity among municipalities increased between 2000 and 2009. The number of municipalities with MHIs within 20 percent of the region's MHI declined from 138 in 2000 to 120 in 2009. The following table provides an overview of MHI disparities among municipalities in the region.
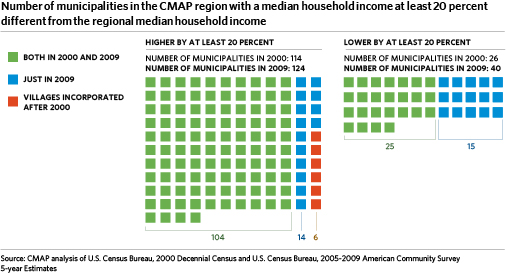
In 2000, 114 municipalities had an MHI that exceeded the region's MHI by 20 percent or more. In 2009, 124 municipalities were in this high MHI group, consisting of 104 municipalities that stayed in this high MHI group and 20 (including six newly incorporated villages) that joined the high MHI group. The number of municipalities with MHIs lower than the region by at least 20 percent grew from 26 in 2000 to 40 in 2009. Though the low MHI group has fewer municipalities than the high MHI group, the low group gained more members and lost fewer members than the high group.
Over the past decade, the region's population has shifted to outlying areas, while income disparity among municipalities has increased. Some communities are the beneficiaries of these trends, while others experienced slow growth or population decline. CMAP will continue to analyze these data to help decision makers achieve a thorough understanding of its communities' socioeconomic conditions, with the goal of bringing economic growth and prosperity to the whole region.